
|
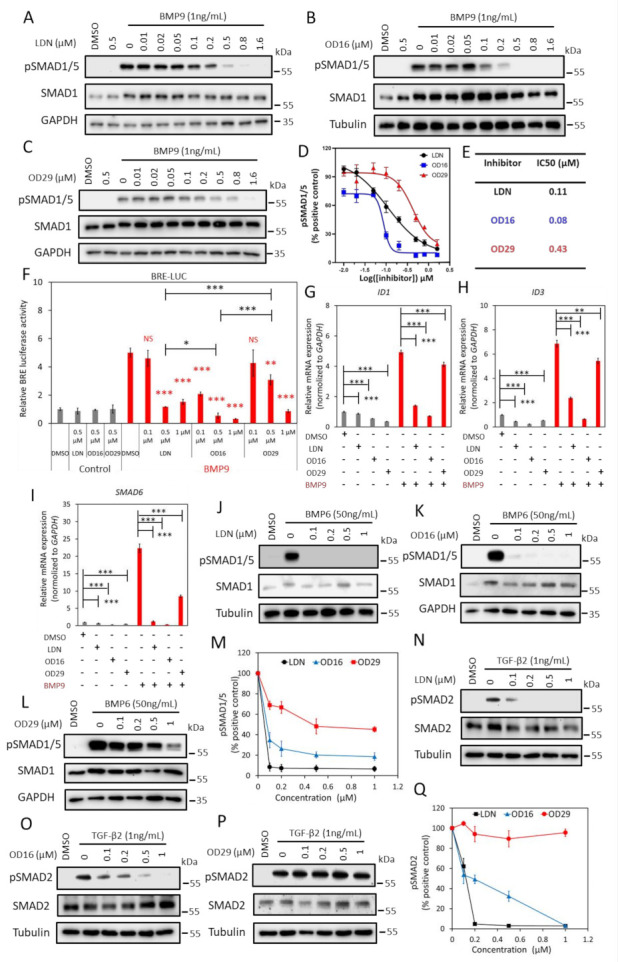
Figure 2 OD16 and OD29 inhibit BMP, but not TGF-β signaling in EA.hy926 cells. (A–C) Western blot analysis of the dose-dependent effects of LDN-193189 (A), OD16 (B), and OD29 (C) on BMP9 (1 ng/mL)-induced SMAD1/5 phosphorylation in EA.hy926 cells. (D) Quantification of the BMP9-induced pSMAD1/5 phosphorylation. GAPDH or Tubulin was used for protein loading controls. Results from three biologically independent experiments were integrated. The results are expressed as mean ± SD. (E) IC50 values of LDN-193189, OD16, and OD29 on BMP9-induced pSMAD1/5 response in EA.hy926 cells. (F) Inhibitory effects of LDN-193189, OD16, and OD29 on BMP9-induced BRE transcriptional reporter activity in EA.hy926 cells. Cells were preincubated with the inhibitors at three different concentrations (0.1 µM, 0.5 µM, and 1 µM) for 1 h and then stimulated with BMP9 at 1 ng/mL for 16 h with the presence of the compounds. Representative results from three biologically independent experiments are shown as mean ± SD. * p < 0.05, ** p < 0.005, *** p < 0.001. NS, non-significant. (G–I) RT-qPCR analysis of the effects of LDN-193189, OD16, OD29 (0.5 µM) or vehicle control (DMSO) on BMP9 (1 ng/mL)-induced ID1 (G), ID3 (H), and SMAD6 (I) mRNA expression in EA.hy926 cells. Expression levels were normalized to those of the housekeeping gene GAPDH. Results from three biologically independent experiments are shown as mean ± SD. ** p < 0.005, *** p < 0.001. (J–L) Western blot analysis of the dose-dependent effects of LDN-193189 (J), OD16 (K), OD29 (L), or vehicle control (DMSO) on BMP6 (50 ng/mL)-induced SMAD1/5 phosphorylation in EA.hy926 cells. (M) Quantification of the BMP6-induced SMAD1/5 phosphorylation. GAPDH or Tubulin was used as loading controls. (N–P) Western blot analysis of the dose-dependent effects of LDN-193189 (N), OD16 (O), OD29 (p), or vehicle control (DMSO) on TGF-β2 (1 ng/mL)-induced SMAD2 phosphorylation in EA.hy926 cells. (Q) Quantification of the TGF-β2-induced SMAD2 phosphorylation. Tubulin was used as a loading control. The results from three biologically independent Western blot experiments were integrated. The results are expressed as mean ± SD. Complete Western Blot images of subfigures (A–C) and (J–L,N–P) are available in Figure S9.