
Fig. 8
- ID
- ZDB-IMAGE-210703-18
- Publication
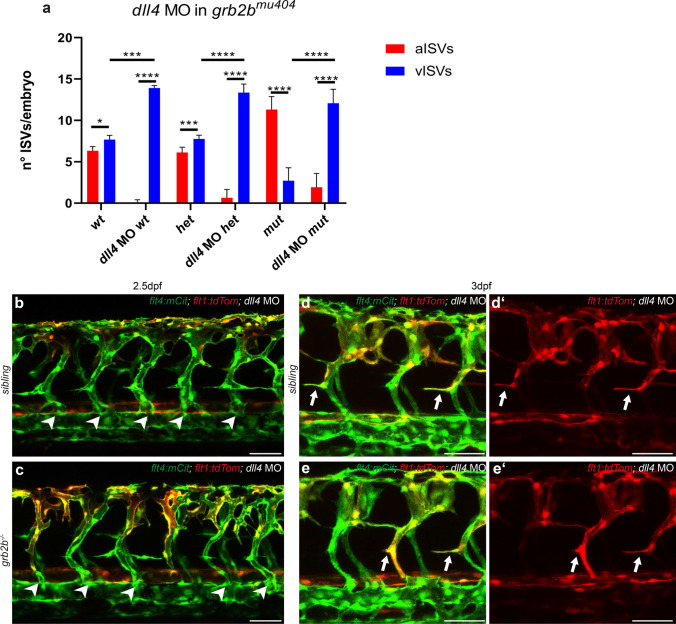
- Mauri et al., 2021 - The adaptor protein Grb2b is an essential modulator for lympho-venous sprout formation in the zebrafish trunk
- All Figures
- Figures for Mauri et al., 2021
|
Fig. 8