
Image
|
Figure Caption
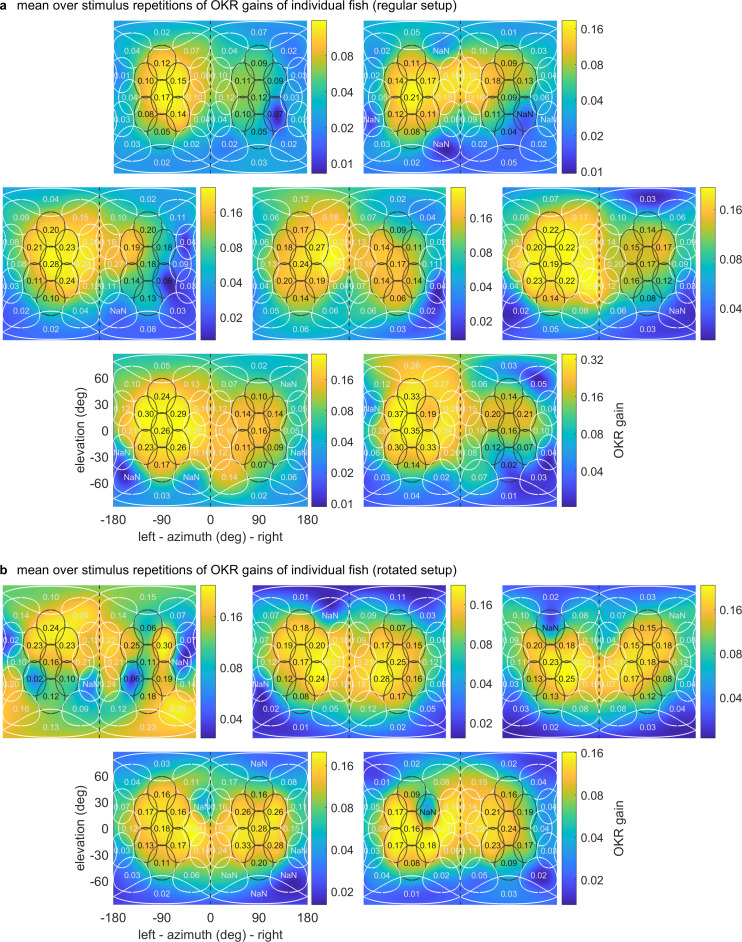
Figure 4—figure supplement 2. Mercator projections of OKR gain data as in Figure 3e and Figure 4e–h, but shown here for individual fish in (a) the regular setup, (b) the rotated arena. Data from n = 1 fish per panel. The results of the first fish in (b) are so irregular as to have likely been caused by experimenter error in preprocessing, rather than biologically meaningful differences. We thus excluded this fish from any analyses, such as the those for Figure 3 and Figure 4.
Acknowledgments
This image is the copyrighted work of the attributed author or publisher, and
ZFIN has permission only to display this image to its users.
Additional permissions should be obtained from the applicable author or publisher of the image.
Full text @ Elife