
Image
|
Figure Caption
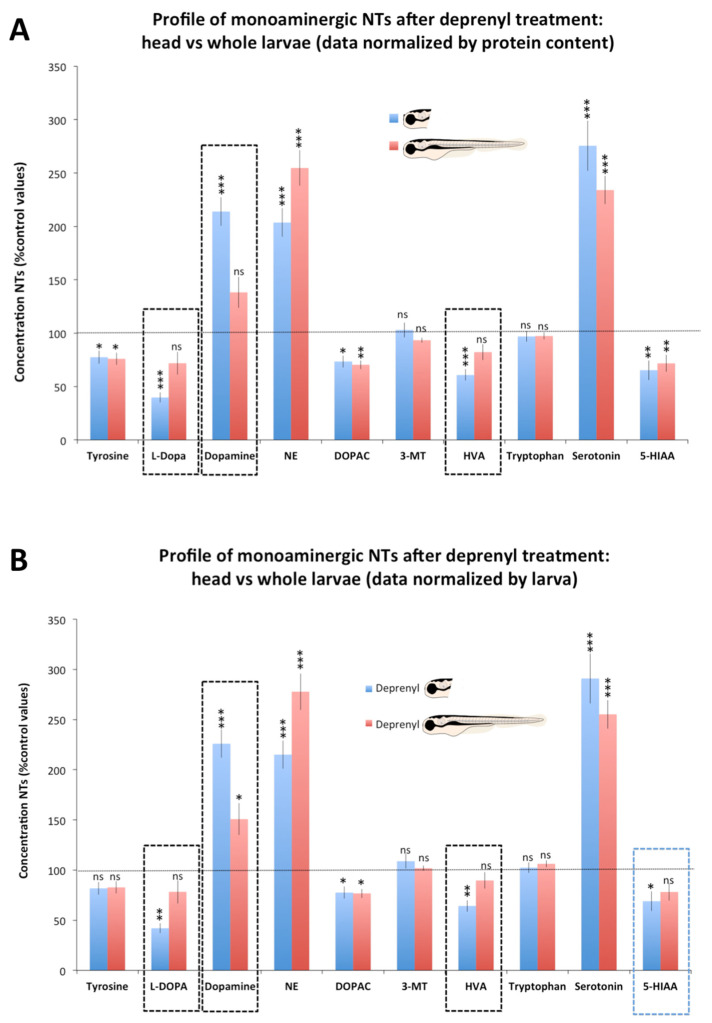
Figure 3 Profile of monoaminergic neurochemicals after deprenyl treatment: head vs. whole body. Concentrations are presented as percentage of the control values. (A) Data normalized by protein content; (B) Data normalized by larva. Student’s t-test (n = 8 pools); ns: non-significant, * p < 0.05, ** p < 0.01, *** p < 0.001; Data from 2 independent experiments.
Acknowledgments
This image is the copyrighted work of the attributed author or publisher, and
ZFIN has permission only to display this image to its users.
Additional permissions should be obtained from the applicable author or publisher of the image.
Full text @ Toxics