
Image
|
Figure Caption
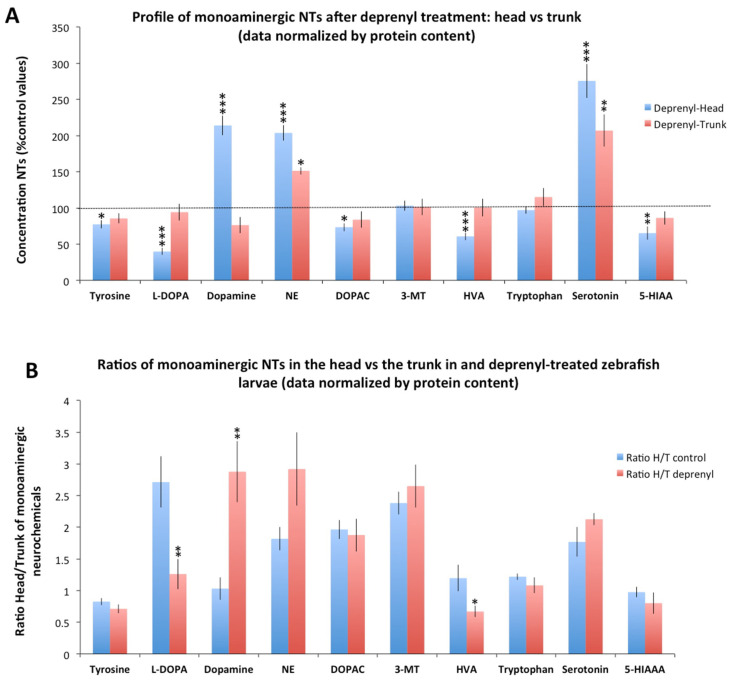
Figure 2 Distribution of monoaminergic neurochemicals between the head and trunk of zebrafish larvae exposed to 5 µM deprenyl for 24 h. (A) Concentration of monoaminergic neurochemicals in the head and trunk of larvae exposed to deprenyl, expressed as a percentage of the control values; (B) Ratio of head/trunk for the ten selected monoaminergic neurochemicals in control and deprenyl-treated zebrafish larvae. Data was normalized by protein content. Student’s t-test (n = 8 pools); * p < 0.05, ** p < 0.01, *** p < 0.001; Data from 2 independent experiments.
Acknowledgments
This image is the copyrighted work of the attributed author or publisher, and
ZFIN has permission only to display this image to its users.
Additional permissions should be obtained from the applicable author or publisher of the image.
Full text @ Toxics