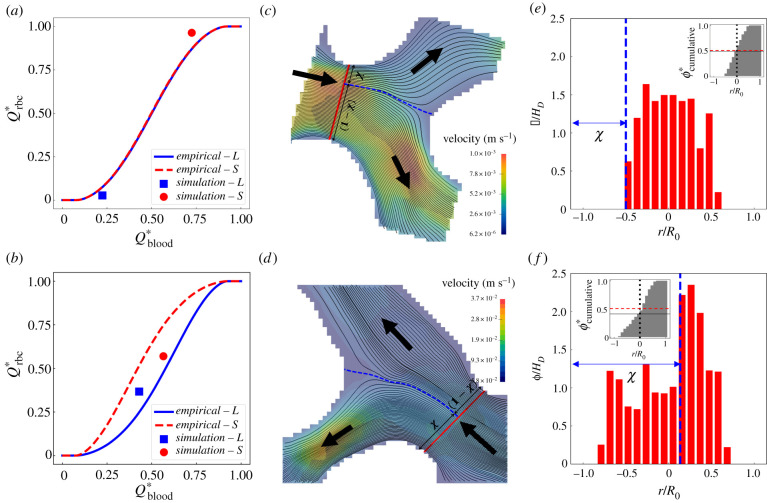
Occasional deviation of simulation data from the empirical model [51] due to the asymmetry of haematocrit profile in the parent branch. (a,b) Two exemplar divergent bifurcations for which the simulation data (square/circle symbols) deviate from PSM predictions (solid lines). (c,d) Visualization of the flow streamlines separated into the child branches on the mid-plane of the bifurcation (extracted from the 3D simulation). The blue dashed line indicates the location of the separation surface. (e,f) Cross-sectional haematocrit profile in the parent branch, at a position marked by the red solid line in (c,d). The blue dashed line corresponds to the separation surface of flow streamlines as in (c,d). The insets of (e,f) show the cumulative haematocrit distribution corresponding to the haematocrit profile.
Acknowledgments
This image is the copyrighted work of the attributed author or publisher, and
ZFIN has permission only to display this image to its users.
Additional permissions should be obtained from the applicable author or publisher of the image.
Full text @ J. R. Soc. Interface
Your Input Welcome
Thank you for submitting comments. Your input has been emailed to ZFIN curators who may contact you if
additional information is required.
Oops. Something went wrong. Please try again later.