IMAGE

Figure 5.

ID
ZDB-IMAGE-210628-18
Source
Figures for Zhou et al., 2021
Image
Figure Caption

Figure 5.

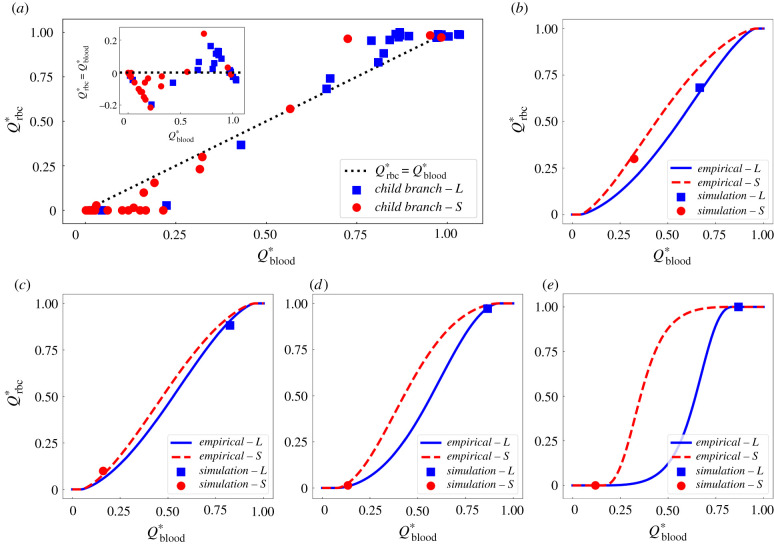
Comparison of simulation data with empirical predictions by the phase separation model [51]. (a) Simulation data of fractional RBC flux Qrbc against fractional blood flow Qblood in the relatively larger child branch ‘L’ (blue squares) and smaller child branch ‘S’ (red circles) from all investigated bifurcations. The inset shows similar results as in figure 4b (characterizing the disproportionality index ΔQ=QrbcQblood against Qblood), but with additional information of relative vessel size for child branches in each bifurcation. The black dotted line represents a linear hypothesis for Qrbc and Qblood in the absence of plasma skimming. (be) Four exemplar bifurcations in which the simulation data (squares and circles) agree well with empirical predictions (solid lines) for both the ‘L’ and ‘S’ child branches.

Acknowledgments
This image is the copyrighted work of the attributed author or publisher, and ZFIN has permission only to display this image to its users. Additional permissions should be obtained from the applicable author or publisher of the image. Full text @ J. R. Soc. Interface