
|
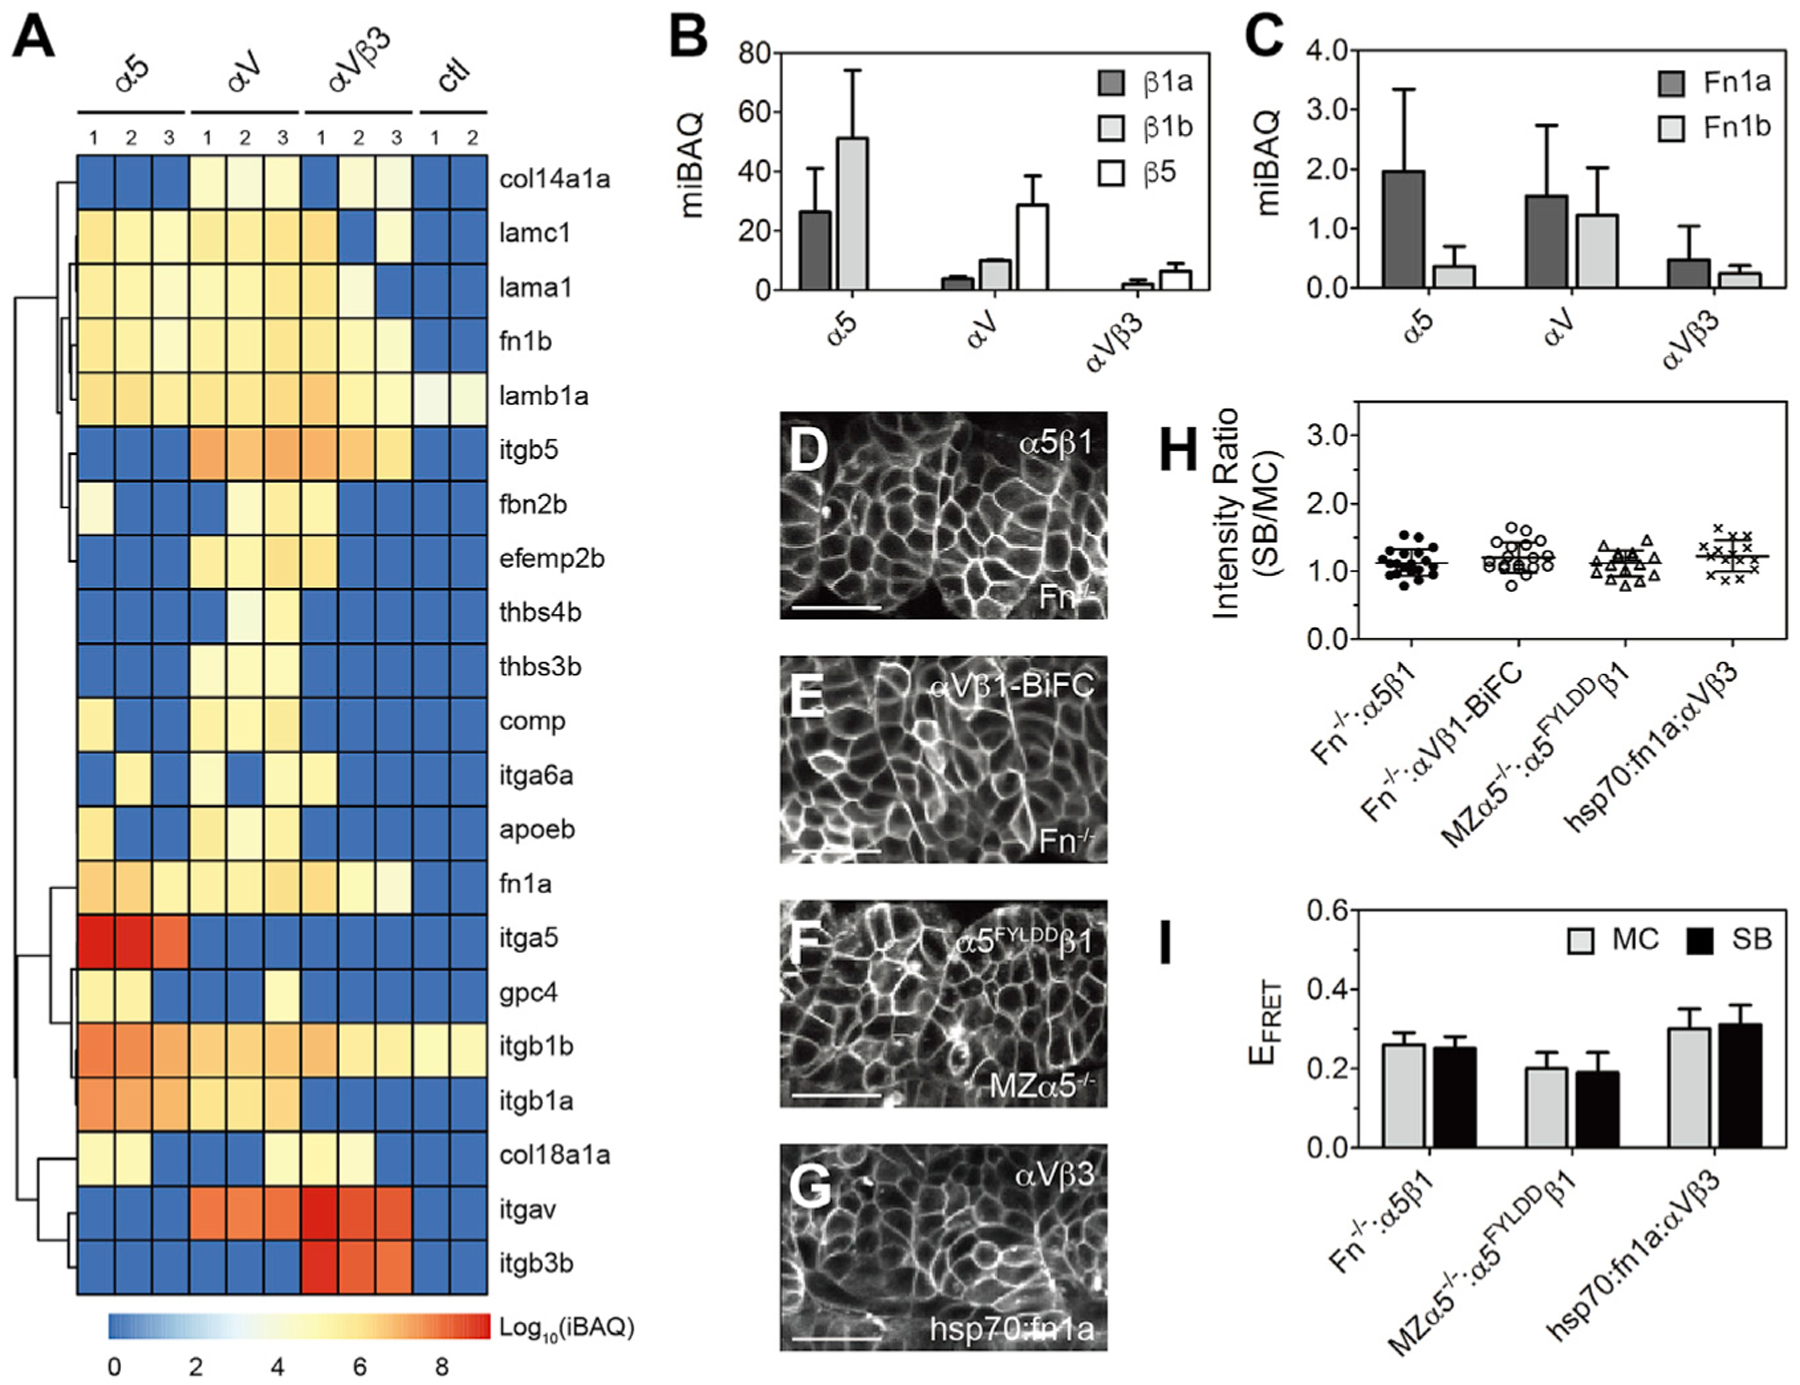
Figure 3. (A) Integrins and ECM proteins co-immunoprecipitated with integrins α5, αV, or αVβ3 identified via mass spectroscopy. The intensity-based absolute quantification (iBAQ) from each replicate is color coded to show relative protein abundance. Hierarchical cluster analysis is shown as the dendrogram (see Tables S2 and S3 for protein names). Note that basement membrane ligand laminins (lama1, lamb1a, lamc1) are roughly equal in all three datasets, while thrombospondins (thbs3b, thbs4b) and cartilage oligomeric matrix protein (comp/thbs5) are found exclusively in the αV dataset. ctl, control (FLAG-tagged myristoylated membrane-anchored GFP [mem-GFP]). (B and C) Integrin β subunits (B) and Fn (C) quantification using median-normalized iBAQ (miBAQ). Bar indicates mean ± SD, n = 3. (D–G) Somite localization of integrin α5β1 (D) and αVβ1-BiFC (E) in Fn double-mutant Fn−/− (fn1a−/−;fn1b−/−) embryos, ligand binding-deficient α5FYLDDβ1 in MZα5−/− embryos (F), and αVβ3 in heat shock promoter-driven Fn1a-mKikumi transgenic (hsp70:fn1a) embryos (G). Scale bars, 30 μm. (H and I) Clustering quantification (H) and EFRET (I) of α5β1 in the absence of Fn, α5FYLDD β1 in MZα5−/− embryos, and αVβ3 exposed to extra Fn1a. Fn−/−: α5β1, n = 20 measurements (9 embryos); Fn−/−: αVβ1-BiFC, n = 19 (11 embryos); MZα5−/−: α5FYLDD β1, n = 16 (8 embryos); hsp70:fn1a; αVβ3, n = 15 (7 embryos). Data are mean ± SD.