
|
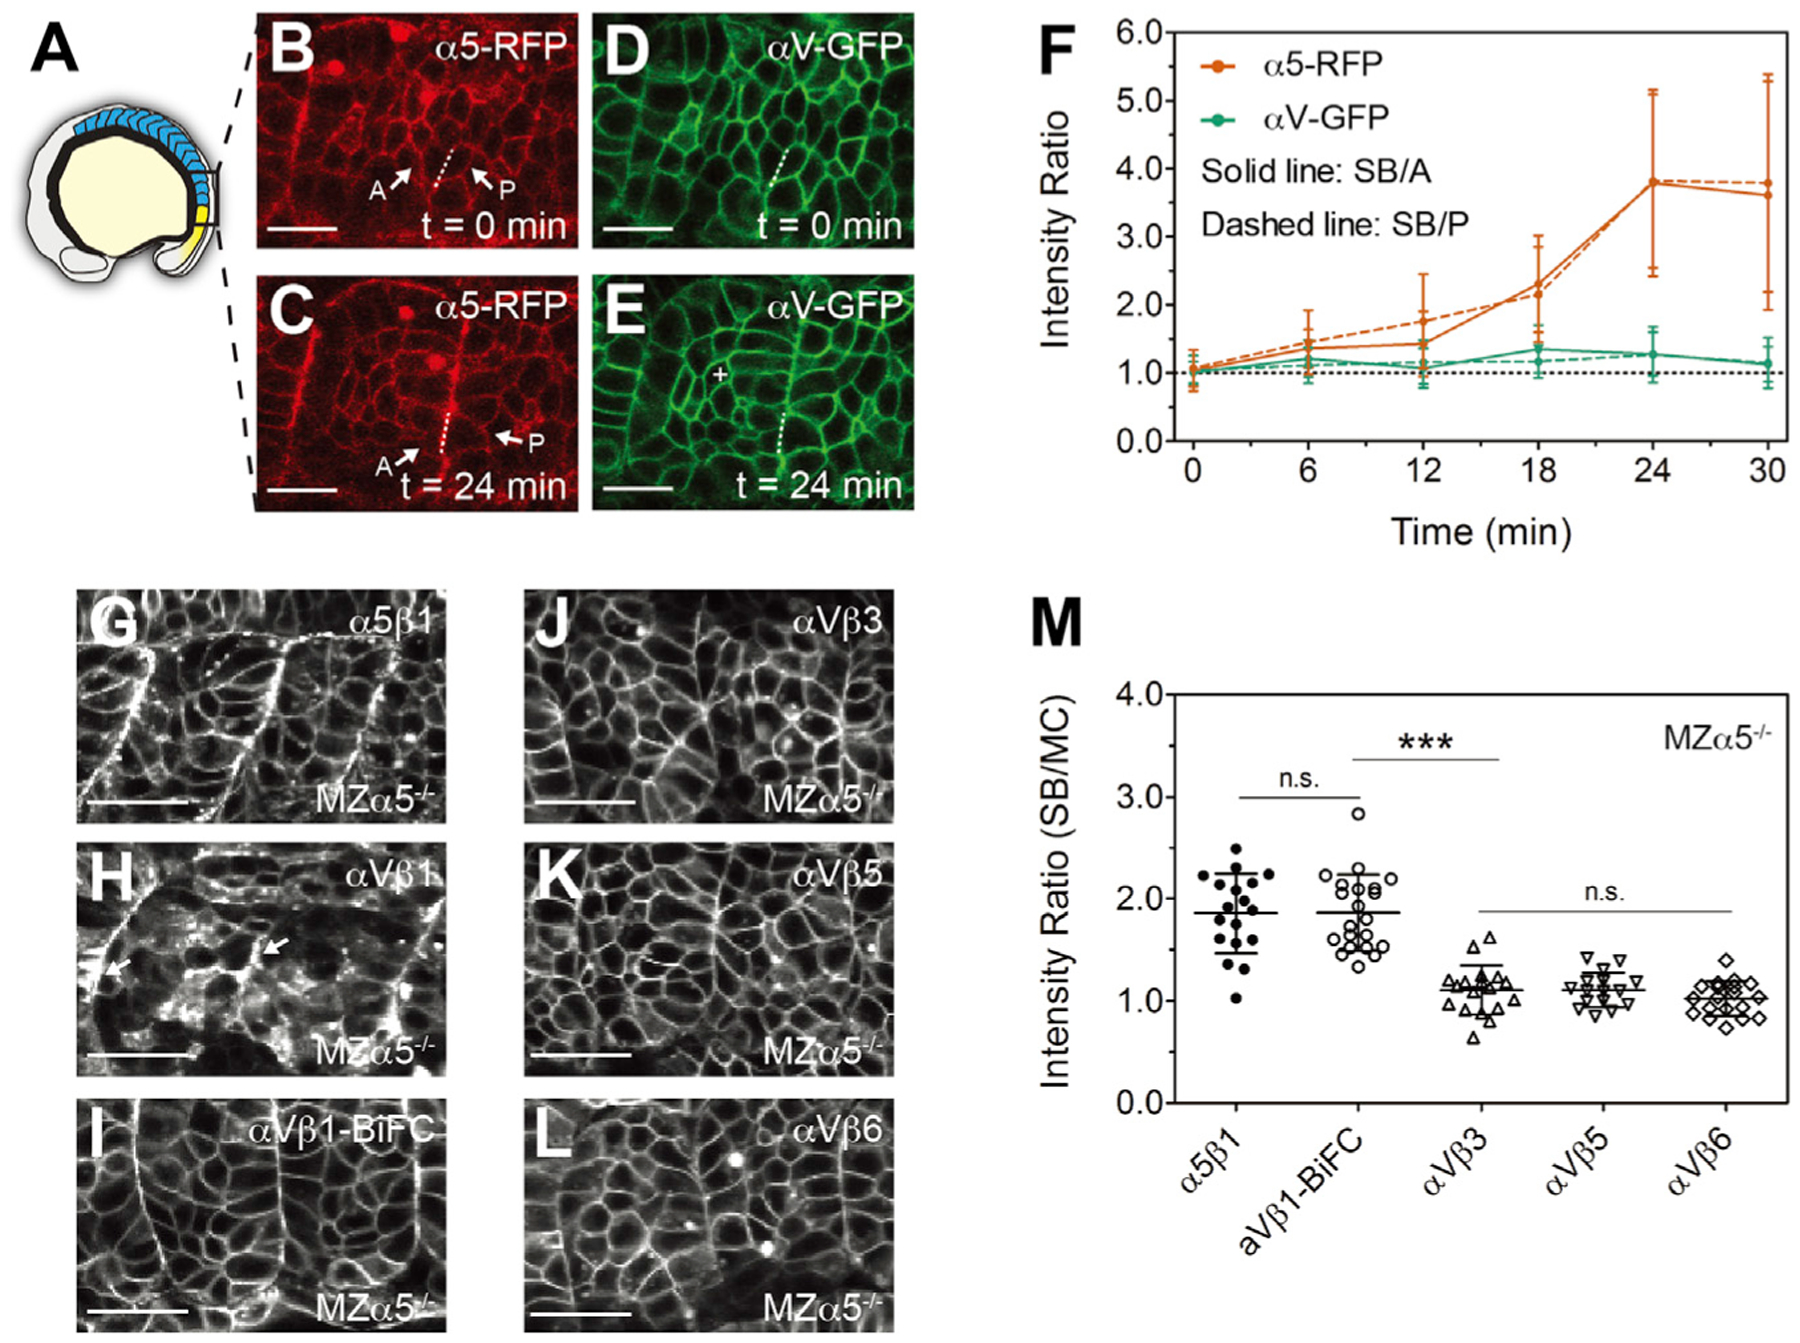
Figure 1. (A) Illustration of a zebrafish embryo highlighting the somites (blue) and presomitic mesoderm (yellow). (B–E) Confocal images of integrin α5-RFP (B and C) and αV-GFP (D and E) in wild-type (WT) embryos. As the somite boundary (SB) forms, α5 clusters to the basal side (dashed lines) of the anterior (A) and posterior (P) boundary cells (arrows). The white cross in (E) denotes a mesenchymal cell (MC) within a somite. Scale bars, 20 μm. (F) Basal/apical ratio of integrin intensity in anterior (SB/A, solid line) and posterior (SB/P, dashed line) boundary cells. Data are mean ± SD from n = 15 cell pairs in six embryos. (G–L) Integrin α5-Aquamarine (Aqm) and αV-Aqm co-expressed with different integrin β subunits tagged with mCitrine (mCit) in developing somites of MZα5−/− embryos. (G) α5β1, (H) αVβ1, (I) αVβ1-BiFC (bimolecular fluorescence complementation, used to increase heterodimer stability), (J) αVβ3, (K) αVβ5, and (L) αVβ6. Arrows in (H) indicate clustering on the somite border. Scale bars, 30 μm. (M) Clustering quantification via the SB/MC intensity ratio. Details of ROI selection shown in Figure S1A. α5β1, n = 18 measurements (12 embryos); αVβ1-BiFC, n = 21 (13 embryos); αVβ3, n = 18 (8 embryos); αVβ5, n = 16 (14 embryos); αVβ6, n = 19 (9 embryos). Data are mean ± SD. ∗∗∗p < 0.0001; n.s., not significant (two-sided t test). See also Figure S1.