
Image
|
Figure Caption
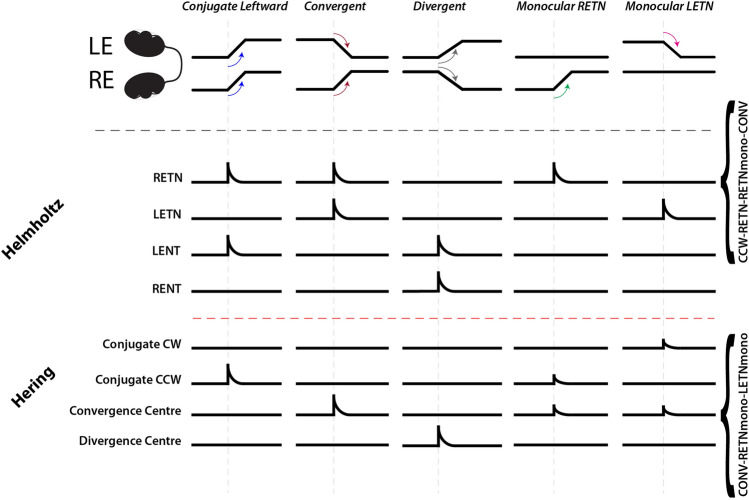
Figure 1
Schematic illustrating the burst neuron populations expected for neurons conforming to either the Hering or Helmholtz hypothesis, and their activity patterns. The descriptors along the right margin indicate how RETN neurons (Helmholtz) and Convergence Centre neurons (Hering) would be classified following our analysis (cf. Table S1).
Acknowledgments
This image is the copyrighted work of the attributed author or publisher, and
ZFIN has permission only to display this image to its users.
Additional permissions should be obtained from the applicable author or publisher of the image.
Full text @ Sci. Rep.