IMAGE

FIGURE 1

ID
ZDB-IMAGE-210623-23
Source
Figures for Lu et al., 2021
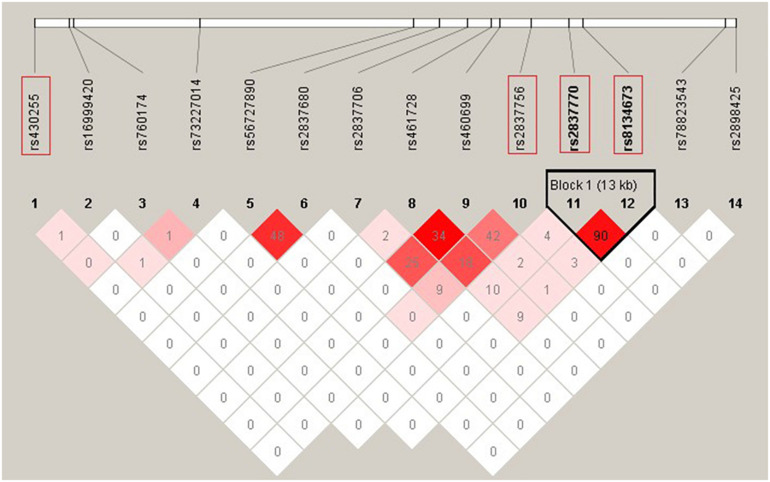
Image
Figure Caption

FIGURE 1

Linkage disequilibrium (LD) pattern of 12 DSCAM single-nucleotide polymorphisms (SNPs) with P < 0.05 in association analysis and two previous reported SNPs. The plot was constructed using the program Haploview, and r2 values (×100) between SNPs are shown in the diamonds. r2 values were calculated using data of 420 HSCR patients and 1,663 controls from the current study. r2 values of 1 represent complete LD, r2 values greater than 0.8 represent strong evidence of LD, r2 values of 0.2–0.8 represent moderate LD, and r2 values less than 0.2 represent low LD. Haplotype blocks were determined using the confidence interval method. Two SNPs (rs2837770 and rs8134673) reported associations with isolated HSCR in previous study, and the two most associated SNPs (rs430255 and rs2837756) are highlighted in the red rectangles.

Acknowledgments
This image is the copyrighted work of the attributed author or publisher, and ZFIN has permission only to display this image to its users. Additional permissions should be obtained from the applicable author or publisher of the image. Full text @ Front Cell Dev Biol