
|
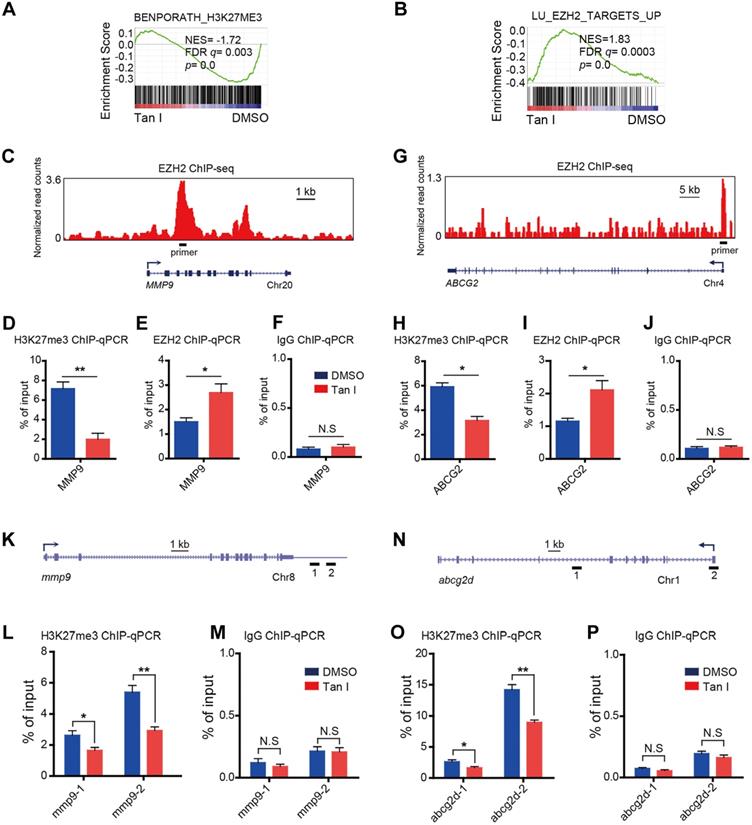
Fig. 6 GSEA of the expression profile of NB4 cells treated with DMSO or Tan I using a histone H3K27me3-associated signature “BENPORATH_H3K27ME3” (A) and an EZH2 target genes-associated signature “LU_EZH2_TARGETS_UP (M2139)” (B). (C) Genome browser track representing the binding sites of EZH2 at MMP9 gene locus in human LNCaP cells. (D-F) ChIP-qPCR assay of H3K27me3 (D), EZH2 (E) or IgG (F) occupancy at MMP9 gene locus in NB4 cells treated with DMSO or 10 µM Tan I for 3 days. (G) Genome browser track representing the binding sites of EZH2 at ABCG2 gene locus in human LNCaP cells. (H-J) ChIP-qPCR assay of H3K27me3 (H), EZH2 (I) or IgG (J) occupancy at the ABCG2 gene locus in NB4 cells treated with DMSO or 10 µM Tan I for 3 days. (K) Horizontal lines with Arabic numeral 1 to 2 indicate the regions at the mmp9 gene locus amplified by qPCR in zebrafish ChIP assay. (L-M) ChIP-qPCR assay for H3K27me3 (L) or IgG (M) occupancy at the mmp9 gene locus in zebrafish embryos treated with DMSO or 60 µM Tan I for 3 days. (N) Horizontal lines with Arabic numeral 1 to 2 indicate the regions at the abcg2d gene locus amplified by qPCR in zebrafish ChIP assay. (O-P) ChIP-qPCR assay for H3K27me3 (O) or IgG (P) occupancy at the abcg2d gene locus in zebrafish embryos treated with DMSO or 60 µM Tan I for 3 days. Data are presented as the mean ± SEM. *p < 0.05, **p < 0.01. All results are from three independent experiments.