
|
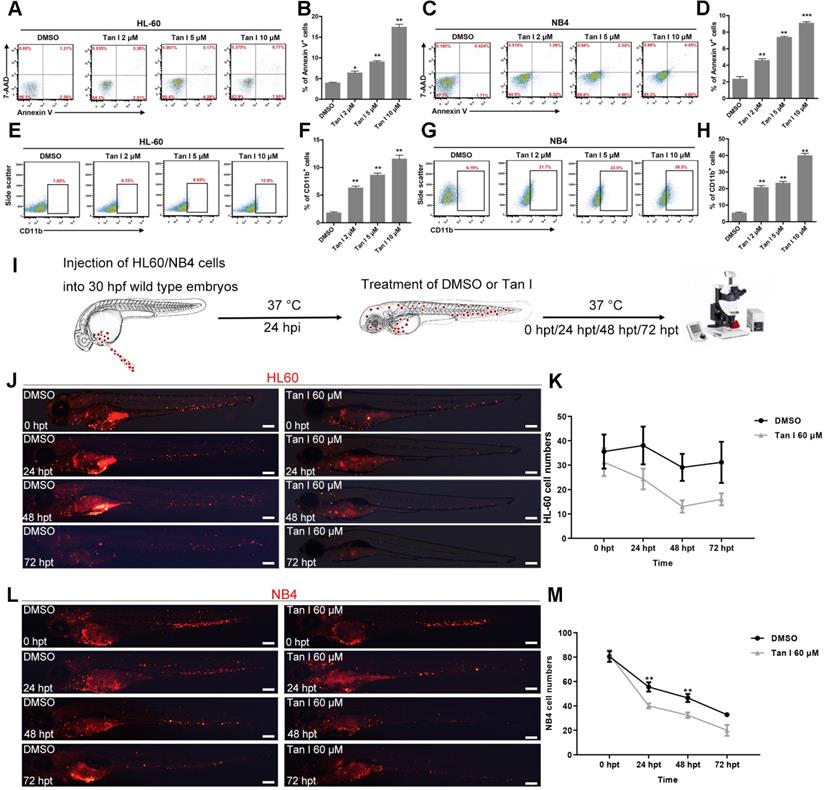
Fig. 3 (A-D) Flow cytometric analyses of Annexin V and 7-AAD staining after treatments of HL-60 (A, B) or NB4 (C, D) cells with DMSO or the indicated concentrations of Tan I for 3 days. (E-H) Flow cytometric analyses of CD11b expression after treatments of HL-60 (E, F) or NB4 (G, H) cells with DMSO or the indicated concentrations of Tan I for 3 days. (I) Cartoon illustrating steps of the embryonic zebrafish xenograft assay, hpi (hours post-injection), hpt (hours post-treatment). (J) Fluorescent images of HL-60-cell grafted zebrafish embryos at indicated times post transplantation with DMSO or Tan I treatments. (K) Statistic analysis of HL-60 cell number in the CHT regions of images in panel J, Error bars represent standard error of means (SEM). (L) Fluorescent images of NB4-cell grafted zebrafish embryos at indicated times post transplantation with DMSO or Tan I treatments. (M) Statistic analysis of NB4 cell number in the CHT regions of embryos shown in panel L, Error bars represent standard error of means (SEM). Scale bars: 200 µm.