
|
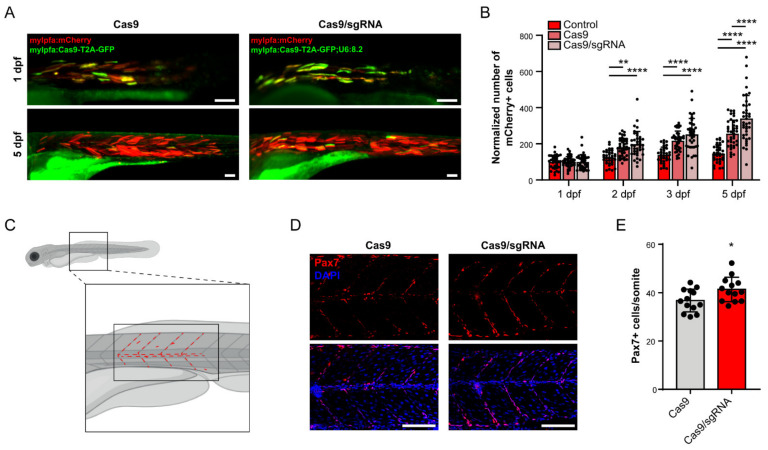
Figure 3 foxm1 in skeletal muscle cells contributes for non-autonomous signaling and tissue homeostasis. (A) mCherry-positive cells in embryos also injected with mylfpa:Cas9-T2A-GFP (Cas9) and mylfpa:Cas9-T2A-GFP;U6:8.2 (Cas9/sgRNA), at 1 and 5 dpf. (B) Quantification of mCherry-positive cells in control, Cas9 and Cas9/sgRNA embryos at 1, 2, 3 and 5 dpf. Values are mean ± SD from n ≥ 34 embryos per condition. ** p < 0.01, **** p < 0.0001 by one-way ANOVA with Bonferroni correction for multiple comparisons. (C) Illustration of a 3 dpf larva and the region used for Pax7 immunostaining quantitative analysis. Red dashed lines represent the quantified cells in the central myotome and the vertical and horizontal myosepta. (D) Embryos of 3 dpf injected with mylfpa:Cas9-T2A-GFP (Cas9) or mylfpa:Cas9-T2A-GFP;U6:8.2 (Cas9/sgRNA) stained with anti-Pax7 antibody and DAPI. (E) Quantification of Pax7-positive cells per somite in 3 dpf embryos. Values are mean ± SD, from n = 13 embryos per condition. * = p < 0.05 by a Student’s t-test. Scale bar: 100 µm.