
IMAGE
Figure 7
- ID
- ZDB-IMAGE-210606-156
- Publication
- Brogi et al., 2021 - β-Glucans as Dietary Supplement to Improve Locomotion and Mitochondrial Respiration in a Model of Duchenne Muscular Dystrophy
- All Figures
- Figures for Brogi et al., 2021
Image
|
Figure Caption
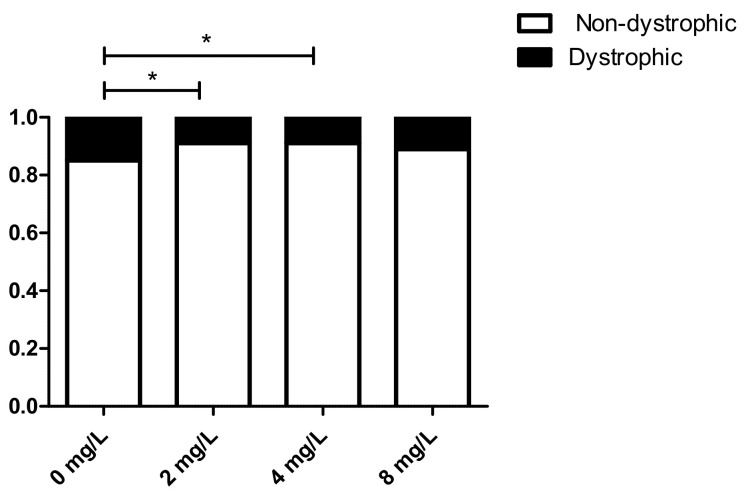
Figure 7 Relative incidence of phenotypes (dystrophic and non-dystrophic) as a function of the concentration of 1,3-1,6 β-glucans in DNS and NDS treatments. (* p ≤ 0.05).
Figure Data
Acknowledgments
This image is the copyrighted work of the attributed author or publisher, and
ZFIN has permission only to display this image to its users.
Additional permissions should be obtained from the applicable author or publisher of the image.
Full text @ Nutrients