
Image
|
Figure Caption
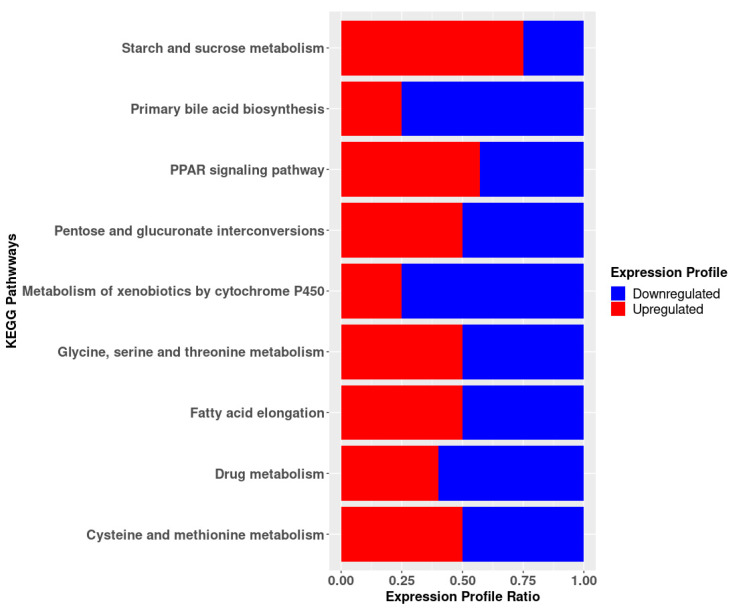
Figure 4 KEGG enrichment analysis from differentially expressed genes between HG-50SBM + 2SPN and LG-50SBM + 2SPN fish. Red and blue regions represent proportion of up- or downregulated genes in HG-50SBM + 2SPN, respectively.
Acknowledgments
This image is the copyrighted work of the attributed author or publisher, and
ZFIN has permission only to display this image to its users.
Additional permissions should be obtained from the applicable author or publisher of the image.
Full text @ Genes (Basel)