
Image
|
Figure Caption
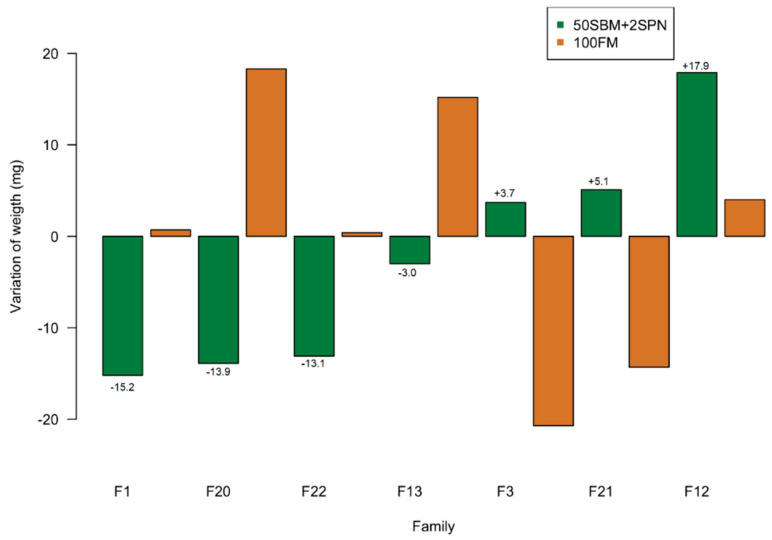
Figure 1 Variation in weight gain of families that showed a genotype-by-environment interaction in response to 50SBM + 2SNP vs. 100FM diets. Families with the greatest (F3, F21, and F12) and least weight gain (F1, F20, F22, and F13) in terms of deviation from the 50SBM + 2SPN population mean (120 ± 33 mg).
Acknowledgments
This image is the copyrighted work of the attributed author or publisher, and
ZFIN has permission only to display this image to its users.
Additional permissions should be obtained from the applicable author or publisher of the image.
Full text @ Genes (Basel)