IMAGE

Figure 5

ID
ZDB-IMAGE-210606-103
Source
Figures for Basnet et al., 2021
Image
Figure Caption

Figure 5

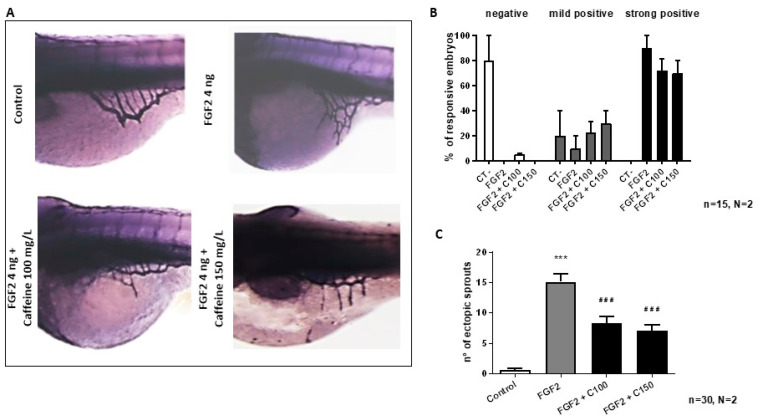
Evaluation of the effects of caffeine treatment on FGF2-microinjected embryos. (A) Representative picture of 72 hpf embryos after AP assay (magnification 63×). (B) Percentage of embryos showing negative, mild positive, and strong positive response following microinjection of FGF2, with or without caffeine treatment. Caffeine treatment in the FGF2 microinjected embryos did not show a significant decrease in either strong positive or mild positive response. However, analysis of the number of ectopic sprouts showed that caffeine treatment significantly reduced the number of ectopic sprouts in the FGF2-injected zebrafish embryos (C). In the bar diagrams: CT-: negative control; FGF2 + C100: FGF2 + caffeine 100 mg/L; FGF2 + C150: FGF2 + caffeine 150 mg/L. Statistical analysis was performed with GraphPad Prism software, version 8.3.0 (GraphPad Software, Inc., La Jolla, CA, USA). *** p < 0.001 between control and FGF2, ### p < 0.001 between FGF2 and caffeine treated groups (FGF2 + C100 and FGF2 + C150).

Acknowledgments
This image is the copyrighted work of the attributed author or publisher, and ZFIN has permission only to display this image to its users. Additional permissions should be obtained from the applicable author or publisher of the image. Full text @ Int. J. Mol. Sci.