
|
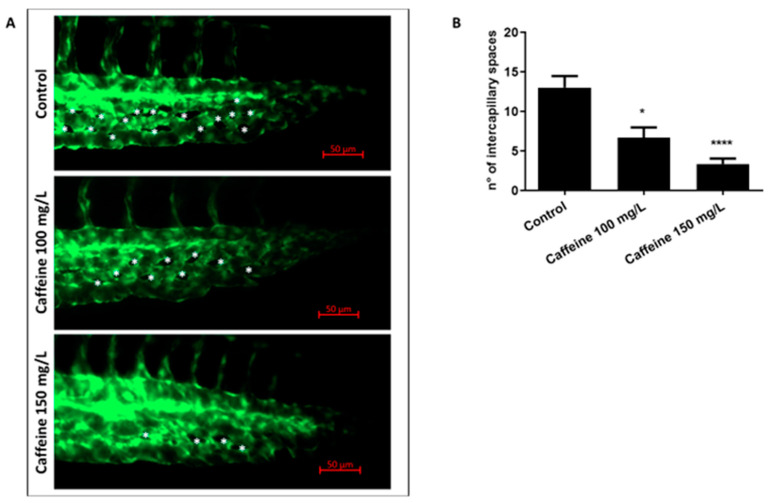
Figure 2 Caffeine affects the number of intercapillary spaces in the CVP. (A) Representative pictures showing the CVP of Tg(kdrl:EGFP) control and treated embryos at 48 hpf. Magnification 32×. Asterisks point to the intercapillary spaces. (B) The bar diagram in the panel shows the average number of intercapillary spaces in control and caffeine (100 and 150 mg/L)-treated embryos. Three biological replicates were performed, with 10 embryos per group. Statistical analysis was performed with GraphPad Prism software, version 8.3.0 (GraphPad Software, Inc., La Jolla, CA, USA). * p < 0.05, **** p < 0.0005, when compared with the control group.