
|
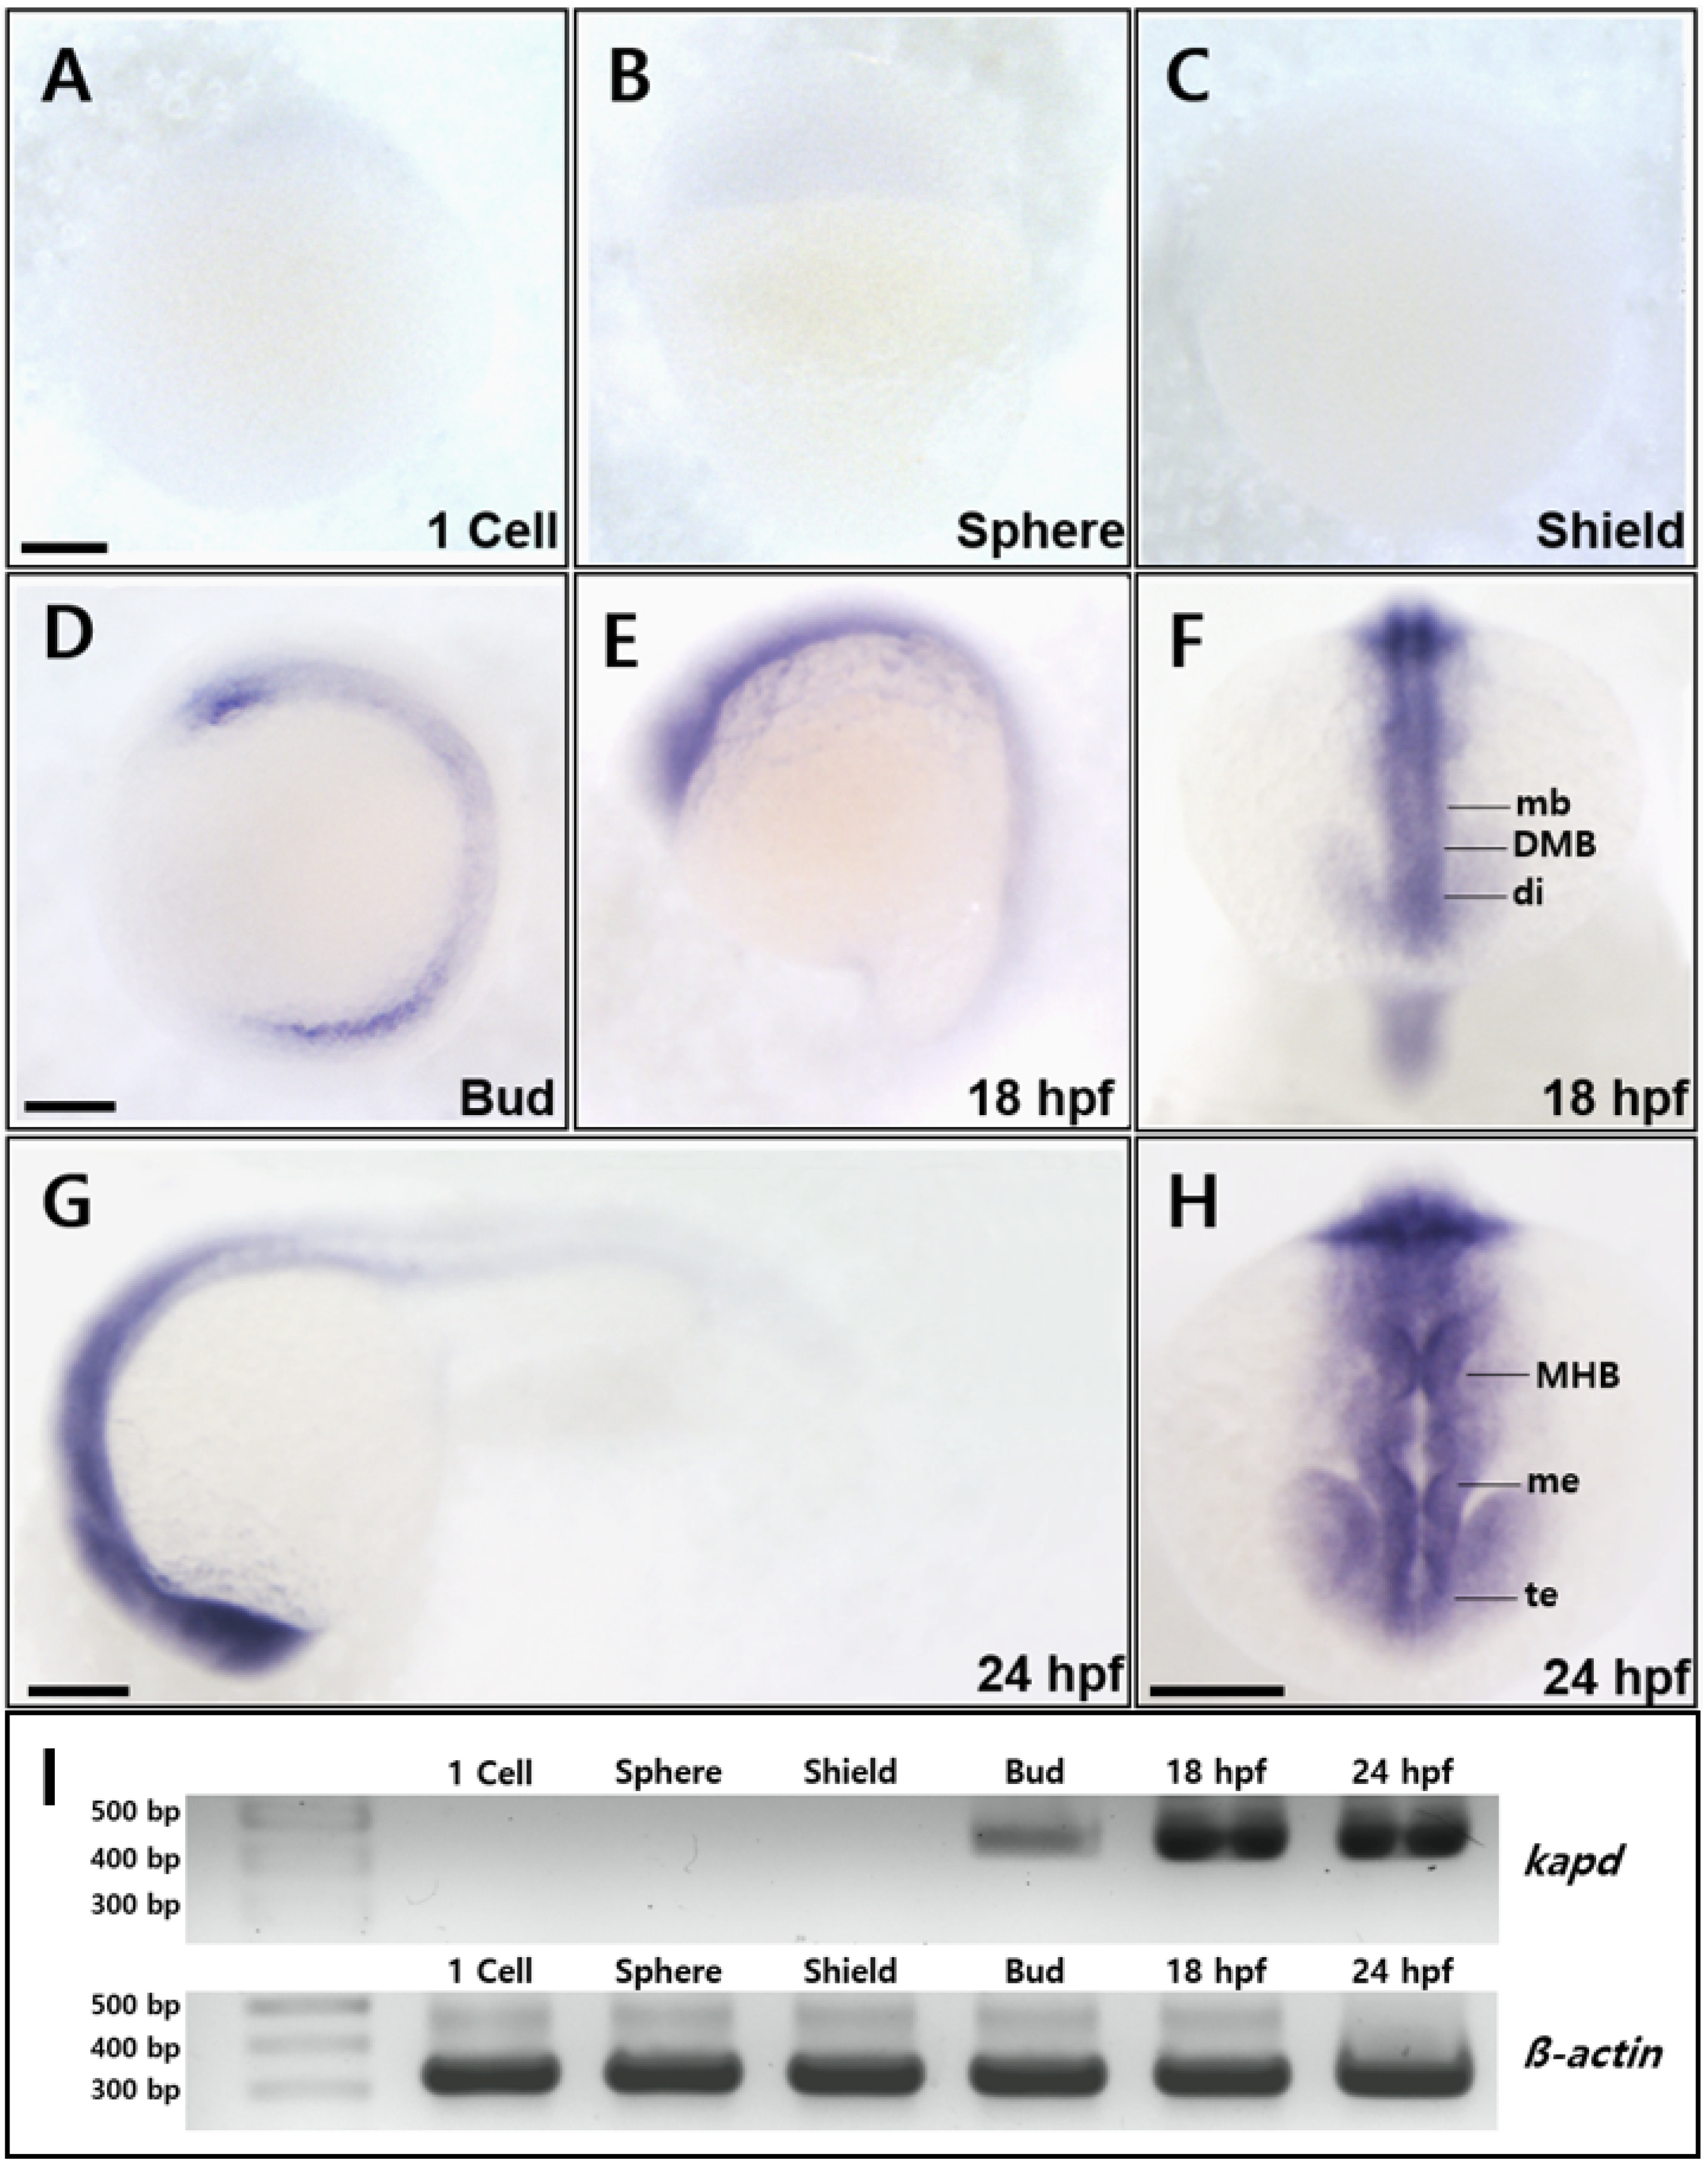
Fig. 2 Spatiotemporal expression patterns of zebrafish kapd. WISH analysis of kapd from the one-cell stage through 36 hpf. (A-C) Transcripts of kapd were not detected from the one-cell stage through the shield stage. (D) At the bud stage, kapd transcripts were first detected in the FP cell of the neural tube. (E and F) Transcripts were abundant in the central nervous system from 10 hpf through to 18 hpf. At 18 hpf, kapd transcripts were distributed in the precursor region of the midbrain, including the diencephalic–mesencephalic boundary along the anterior–posterior (AP) axis (F). (G and H) At 24 hpf, kapd expression was restricted to the forebrain through the hindbrain including the telencephalon, mesencephalon, and rhombomere (H). (I) RT-PCR analysis of kapd transcripts at the developmental stages in zebrafish embryos. β-actin was used as loading control. (A-H) Scale bars = 250 µm. All embryos were collected synchronously from WT zebrafish for WISH analysis at the corresponding stages. mb, midbrain; DMB, diencephalic–mesencephalic boundary; di, diencephalon; MHB, midbrain–hindbrain boundary; me, mesencephalon; te, telencephalon.