
|
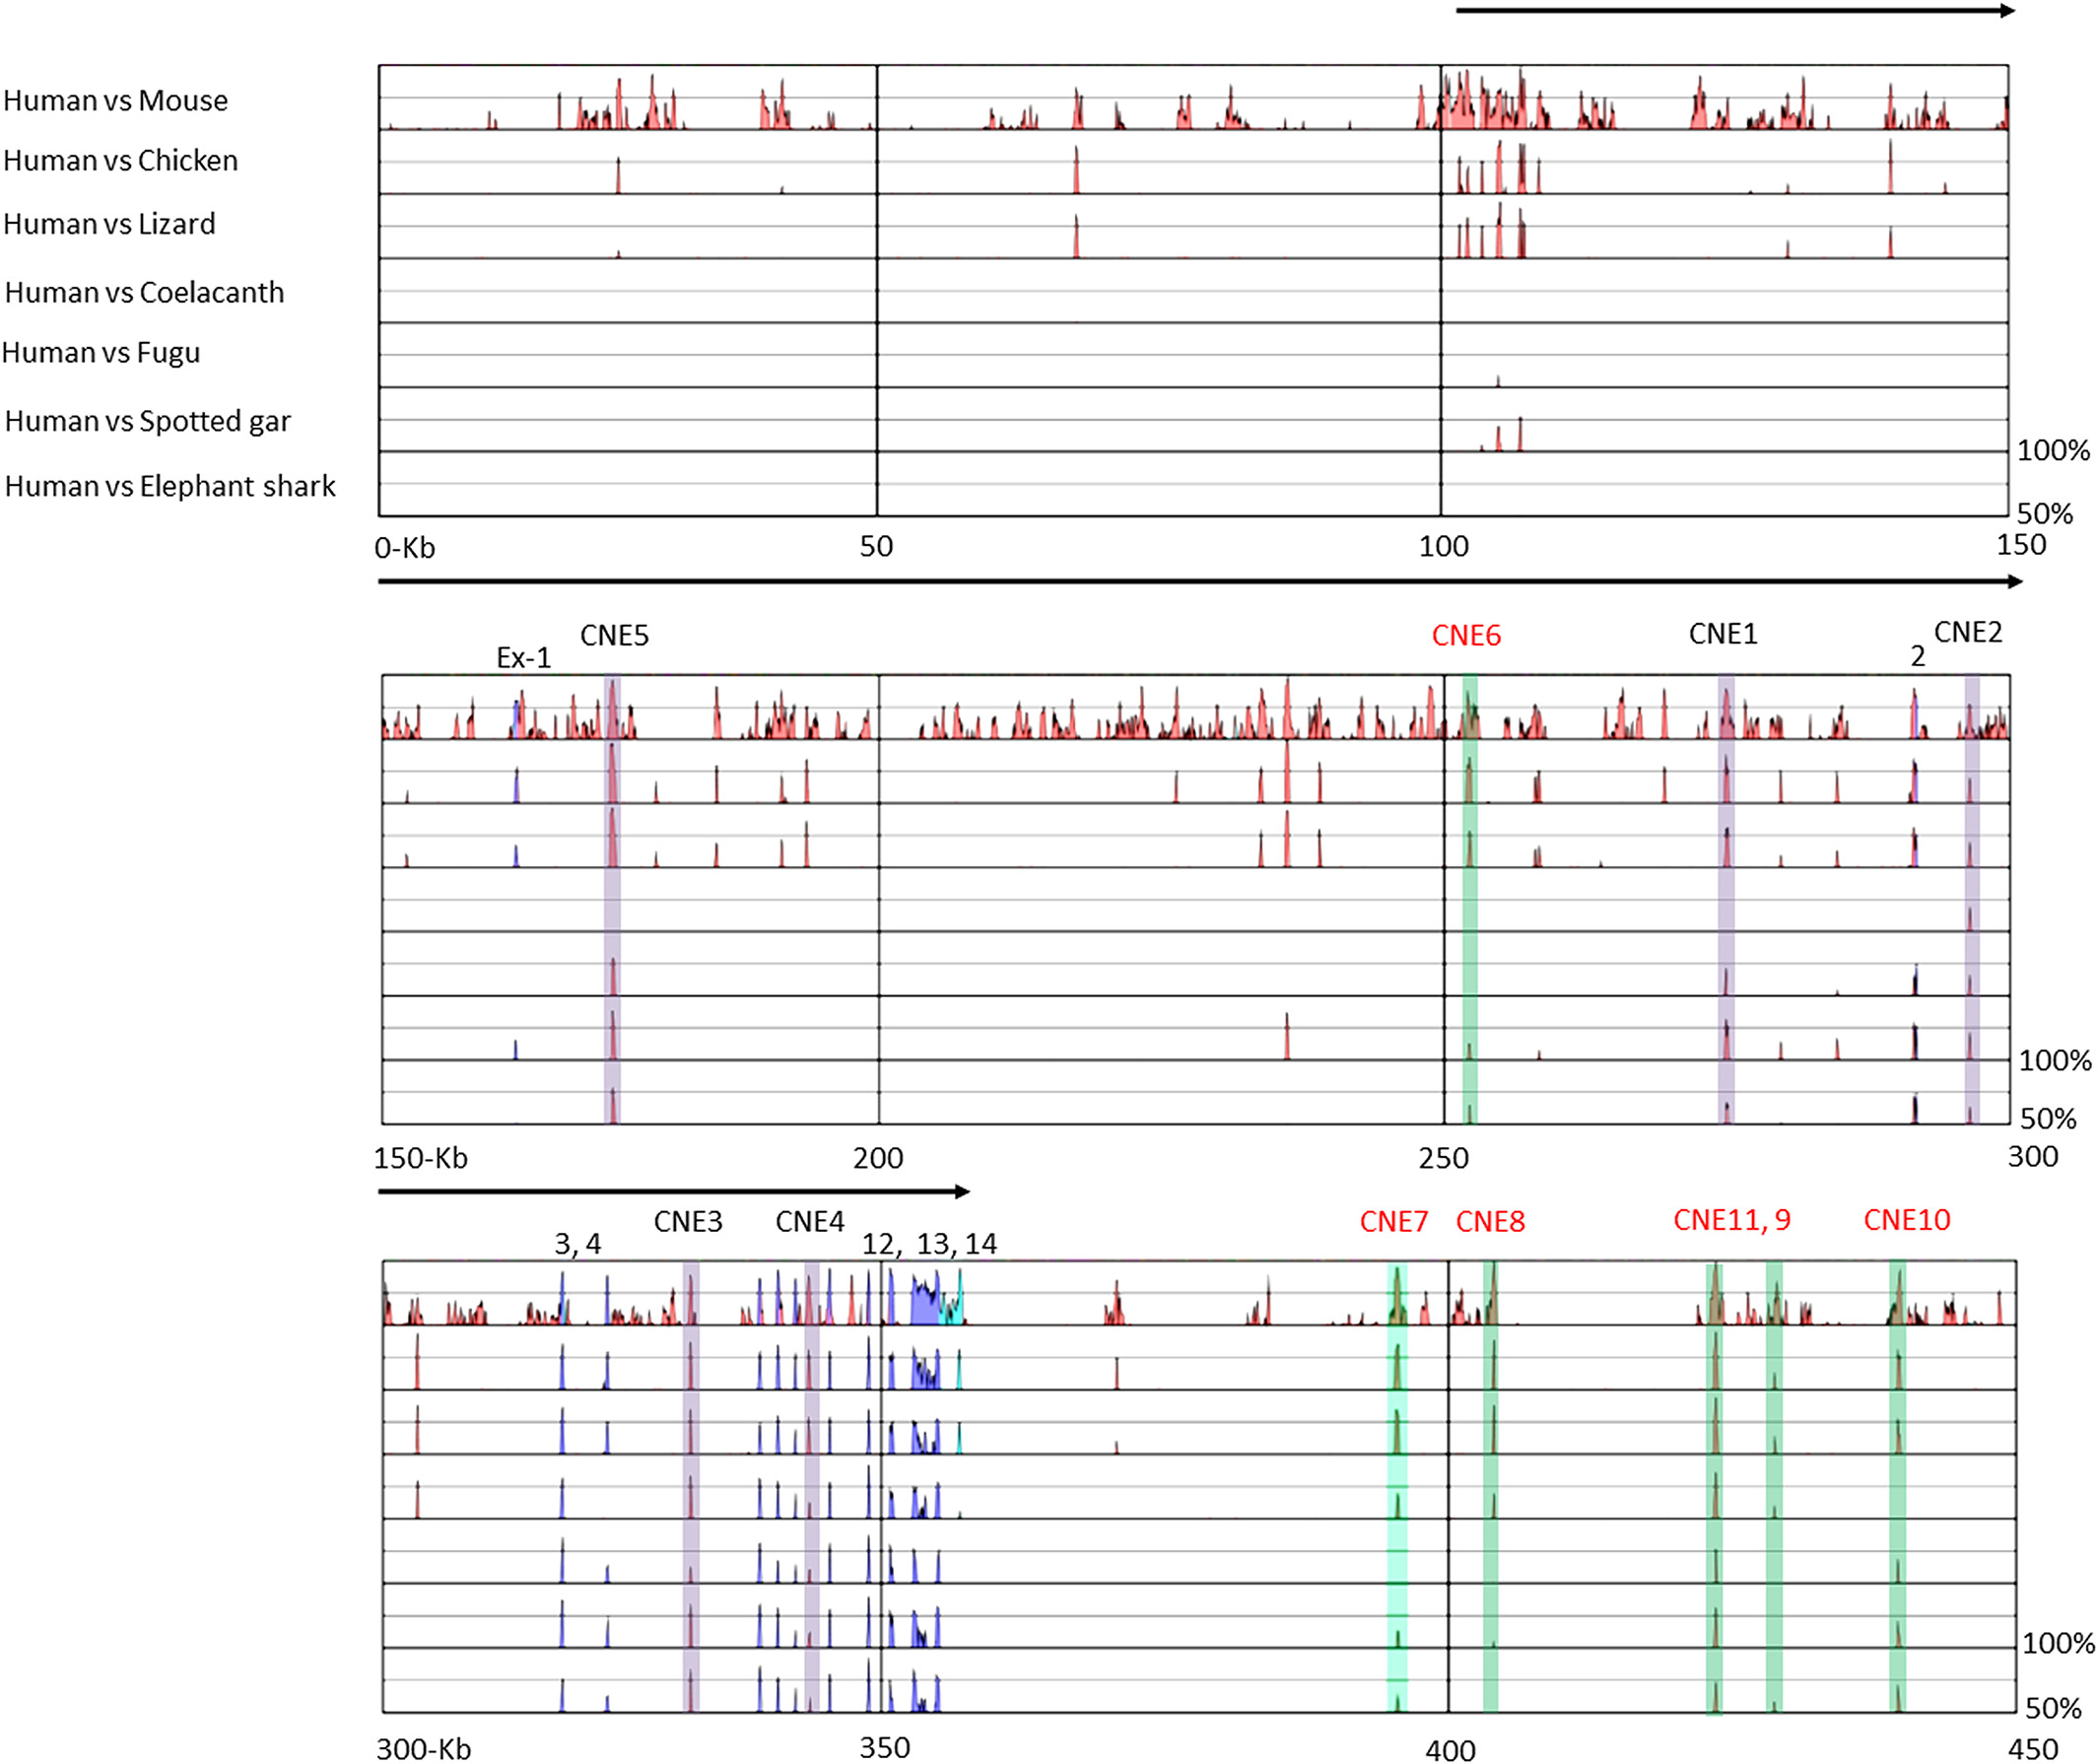
Fig. 1 Multispecies comparative plot of human GLI2 locus. Multispecies comparative analysis of human GLI2 locus and 100 kb flanking region from both directions with orthologous counterparts of tetrapods (mouse, chicken and lizard) and aquatic vertebrates (coelacanth, fugu, spotted gar, and elephant shark). Presented here are visualization tool for alignment (VISTA) graphical output by Shuffle-LAGAN tool using human sequence as the baseline. The black arrow above the plot shows the direction of transcription and length of GLI2 gene (257 kb). The conserved noncoding elements highlighted in light green and indicated on top as red numbers, are selected for functional analysis in this study. CNEs indicated in black are reported previously by our research group.28 Criteria of alignment were 50 bp and 50% conservation cutoff. Conserved coding and noncoding sequences are depicted in blue and pink peaks, respectively. Y-axis indicates percent identity and x-axis indicates the length of sequences. kb, kilobase; Ex, exon; CNE, conserved noncoding element