
Image
|
Figure Caption
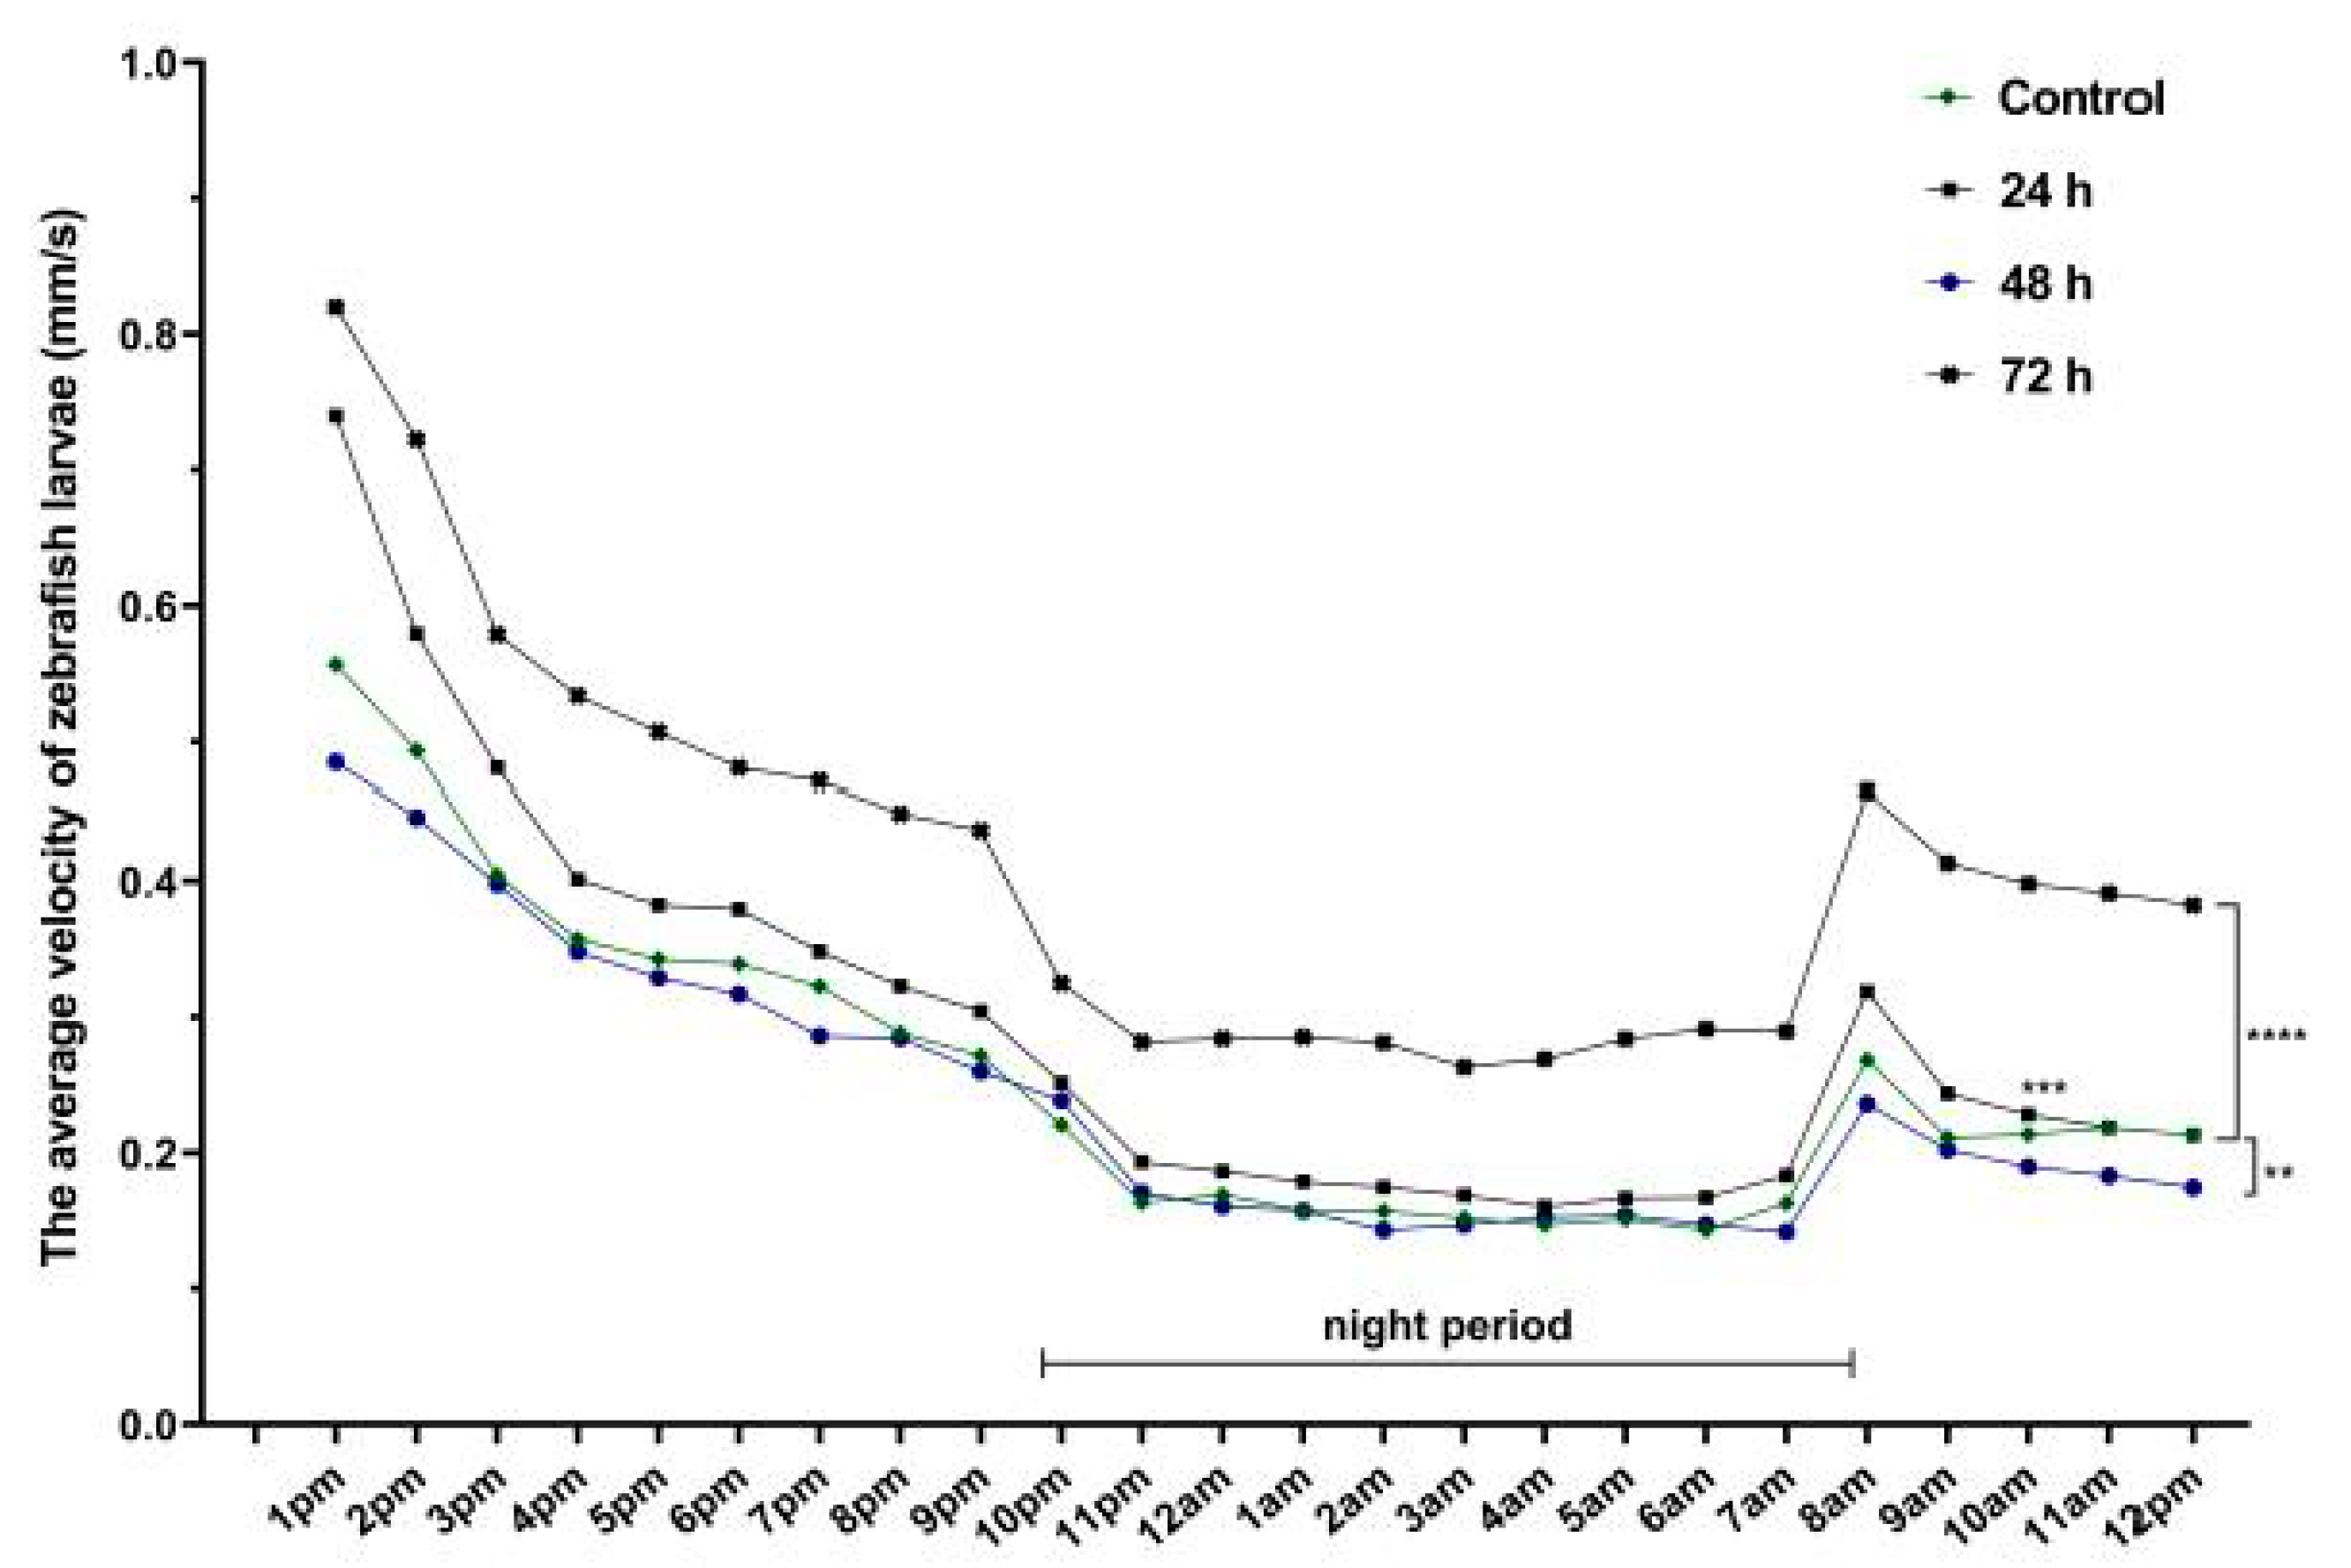
Fig. 4 The average velocity of 6-day-old zebrafish larvae recorded during 24 h (n = 30). Group 1, control; Group 2, group exposed for 24 h to VPA; Group 3, group exposed for 48 h to VPA; and Group 4, group exposed for 72 h to VPA. The data is represented as average ± SEM. Anova and Tukey post-hoc tests, p < 0.05 was considered to be significant. The experimental groups were compared to control group, where ** p < 0.01; *** p < 0.001 and **** p < 0.0001.
Figure Data
Acknowledgments
This image is the copyrighted work of the attributed author or publisher, and
ZFIN has permission only to display this image to its users.
Additional permissions should be obtained from the applicable author or publisher of the image.
Full text @ Brain Sci