
|
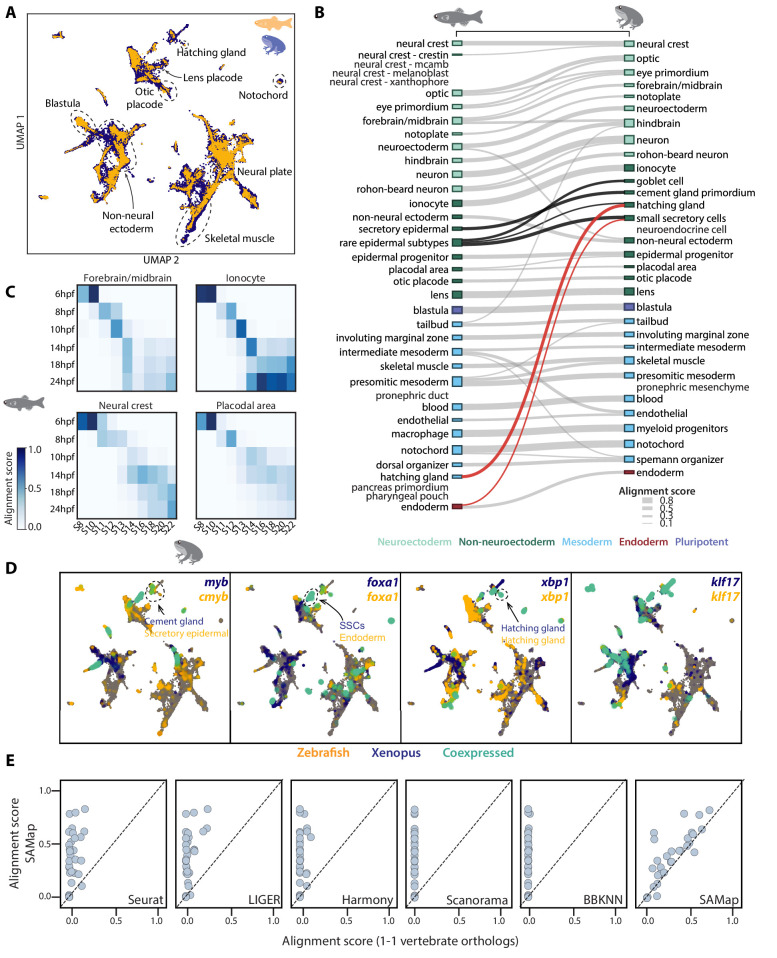
Figure 2 (A) UMAP projection of the combined zebrafish (yellow) and Xenopus (blue) manifolds, with example cell types circled. (B) Sankey plot summarizing the cell type mappings. Edges with alignment score <0.1 are omitted. Edges that connect developmentally distinct secretory cell types are highlighted in black, with connections across germ layers highlighted in red. (C) Heatmaps of alignment scores between developmental time points for ionocyte, forebrain/midbrain, placodal, and neural crest lineages. X-axis: Xenopus. Y-axis: zebrafish. (D) Expressions of orthologous gene pairs linked by SAMap are overlaid on the combined UMAP projection. Expressing cells are color-coded by species, with those connected across species colored cyan. Cells with no expression are shown in gray. The mapped secretory cell types are highlighted with circles. (E) SAMap alignment scores compared to those of benchmarking methods using one-to-one vertebrate orthologs as input. Each dot represents a cell type pair supported by ontogeny annotations.