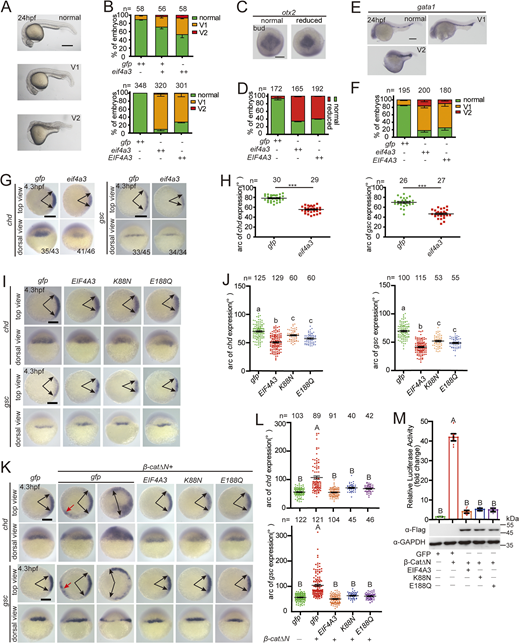
Fig. 4 (A) Representative views of siblings and eif4a3 mutants with a p53 mutant background at 24 hpf. (B,C) Expression of the indicated markers gata1 and rx1 in siblings and eif4a3 mutants with the p53−/− background at 24 hpf. (D) Expression of the indicated dorsoventral markers in siblings and eif4a3 mutants with the p53−/− background at 6 hpf. (E) Quantification of the arc of marker expression shown in D. (F) Expression of the indicated anteroposterior neural markers in siblings and eif4a3 mutants with the p53−/− background at 12.5 hpf. Lateral views with the dorsal side to the right and animal pole upwards. (G) Expression of cdx4 and sp5l in eif4a3 mutants and siblings with the p53−/− background at 80% epiboly stage. Arrowheads indicate the edges of the indicated mRNA expression domains. Lateral views with the dorsal side to the right and animal pole upwards. (H) Depletion of eif4a3 with the p53−/− background elevates the expression of the indicated Wnt direct target genes at 80% epiboly stage, as indicated by qRT-PCR analysis. Embryos are from three pairs of adult fish. Embryos were raised to each indicated stage, subjected to the whole-mount in situ hybridization analysis, photographed and then genotyped in A-G. Each embryo was genotyped and subjected to qRT-PCR in H. Data are mean±s.e.m. *P<0.05; **P<0.01; ***P<0.001. Unpaired t-test, two-tailed. Scale bars: 200 μm.
Image
Figure Caption
Acknowledgments
This image is the copyrighted work of the attributed author or publisher, and
ZFIN has permission only to display this image to its users.
Additional permissions should be obtained from the applicable author or publisher of the image.
Full text @ Development

