
Image
|
Figure Caption
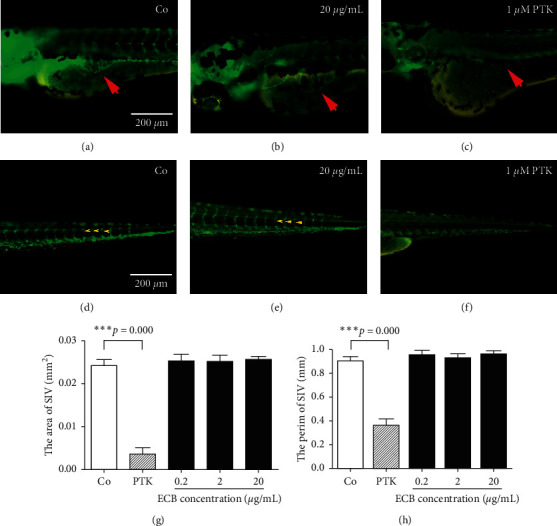
Figure 3 Effect of ECB on SIV and ISV angiogenesis in zebrafish embryos. Zebrafish embryos were imaged after treatment with ECB or PTK from 4 hpf to 72 hpf. (a, b) Control group. (b, e) ECB group. (c, f) PTK group. Red arrows point to SIV vessels above the yolk region (a–c). Yellow arrows show ISVs in the tail region (d–f). (g) The area covered by SIV vessels in zebrafish embryos (p<0.001). (h) The perimeter (length) of SIV vessels in zebrafish embryos (p<0.001). Scale bar = 200 µm.
Acknowledgments
This image is the copyrighted work of the attributed author or publisher, and
ZFIN has permission only to display this image to its users.
Additional permissions should be obtained from the applicable author or publisher of the image.
Full text @ Evid. Based Complement. Alternat. Med.