
Image
|
Figure Caption
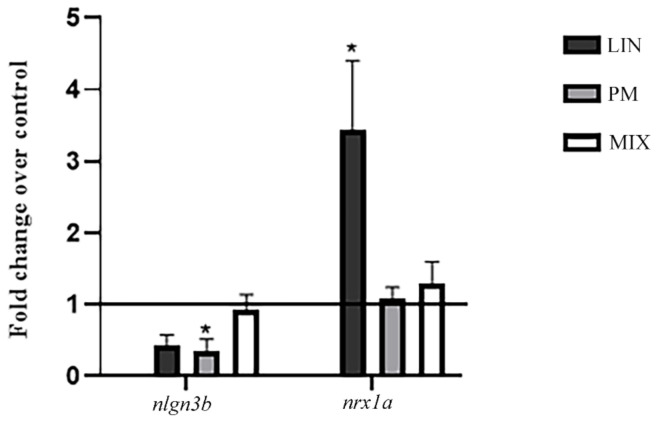
Figure 2 mRNA expression levels of nlgn3b and nrxn1a after exposure of zebrafish larvae to LIN, PM and MIX for 96 hpf. The results are expressed as mean ± SEM. * p < 0.05 vs. Ctr.
Acknowledgments
This image is the copyrighted work of the attributed author or publisher, and
ZFIN has permission only to display this image to its users.
Additional permissions should be obtained from the applicable author or publisher of the image.
Full text @ Int. J. Environ. Res. Public Health