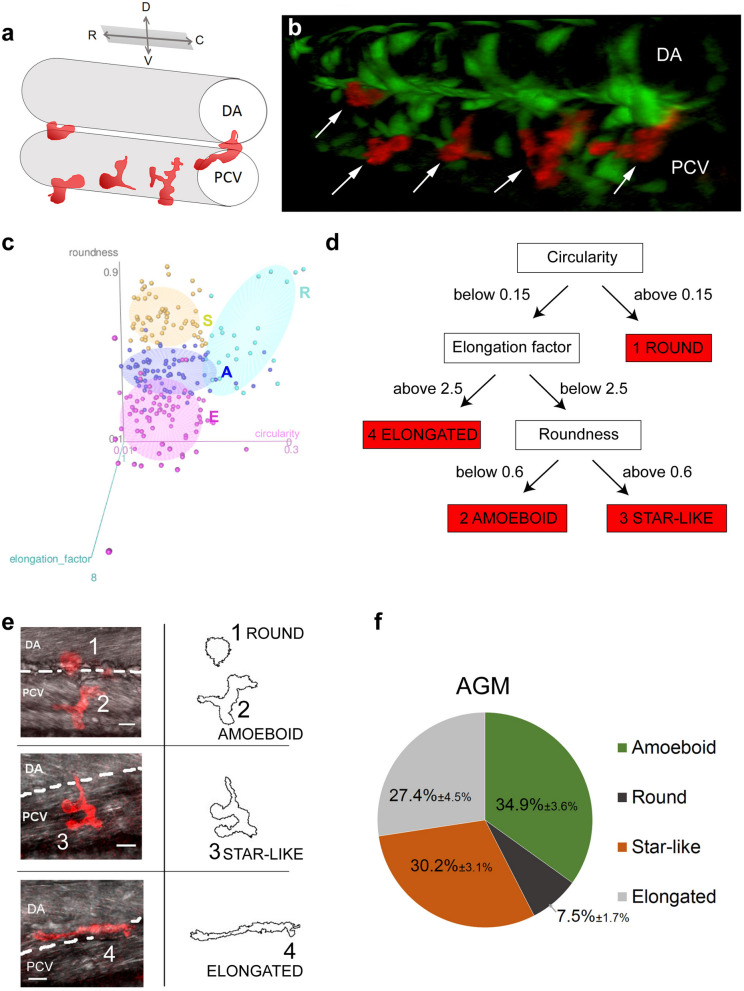
Macrophages in the AGM can be divided into 4 morphological subgroups. (a) The drawing shows a 3D view of vessels and macrophages (red) imaged in (b). (b) 3D view of the AGM in the mid-trunk region of a Tg(kdrl:eGFP//mpeg1:mCherry-F) zebrafish embryo at 48 hpf showing the position of vessels (endothelium in green) and macrophages (in red, white arrows) in the outer side of the vein and in between the dorsal aorta and the cardinal vein. (c) 3D scatter plot showing the 3 attributes (circularity, roundness and elongation factor) used to divide macrophage to their shape categories; plot was generated in R using rgl package25. (d) Diagram of the decision chart for the 4 categories of macrophages delineated according to shape attributes. (e) Representative confocal images (maximum intensity projections) of individual categories with an outline drawing from particle analysis on the right. (f) Graph representing the percentage distribution of the different shape categories per AGM. Data are represented as percentage average ± s.e.m. N = 20 embryos. C caudal, D dorsal, DA dorsal aorta, PCV posterior cardinal vein, R rostral, V ventral. See also Supplementary table S1.
Acknowledgments
This image is the copyrighted work of the attributed author or publisher, and
ZFIN has permission only to display this image to its users.
Additional permissions should be obtained from the applicable author or publisher of the image.
Full text @ Sci. Rep.
Your Input Welcome
Thank you for submitting comments. Your input has been emailed to ZFIN curators who may contact you if
additional information is required.
Oops. Something went wrong. Please try again later.