
Image
|
Figure Caption
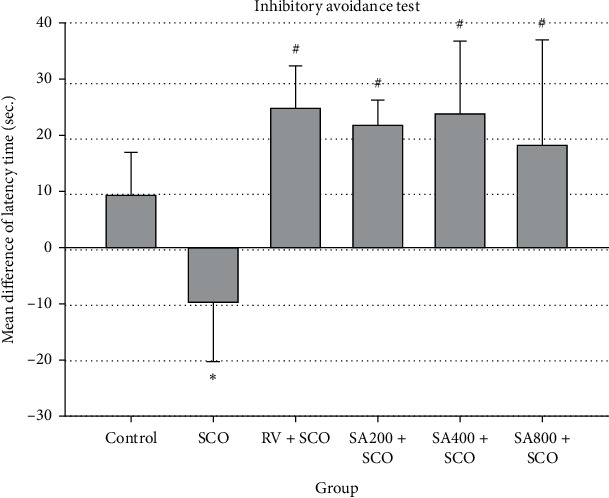
Figure 4 Effect of SCO, RV, and SA extract on the inhibitory avoidance test. Mean difference of latency time in inhibitory avoidance test expressed as mean ± SEM. value <0.05 compared to the control group, *P value <0.05 compared to the SCO group.
Figure Data
Acknowledgments
This image is the copyrighted work of the attributed author or publisher, and
ZFIN has permission only to display this image to its users.
Additional permissions should be obtained from the applicable author or publisher of the image.
Full text @ Adv Pharmacol Pharm Sci