
Image
|
Figure Caption
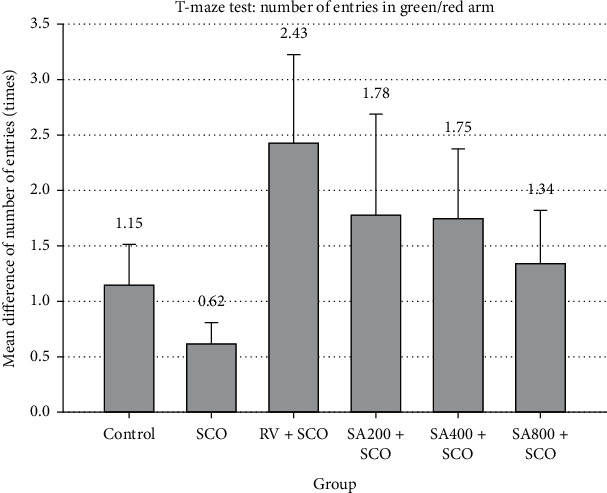
Figure 3 Effect of SCO, RV, and SA extract on number of entries in the colour-biased appetite conditioning T-maze test. Mean difference of total number of entries into green arm and red arm expressed as mean ± SEM. Zebrafish that received RV + SCO, SA200 + SCO, SA400 + SCO, and SA800 + SCO showed mean difference of total number of entries at more than 1 as 2.43 ± 0.80, 1.78 ± 0.91, 1.75 ± 0.63, and 1.34 ± 0.48, respectively.
Figure Data
Acknowledgments
This image is the copyrighted work of the attributed author or publisher, and
ZFIN has permission only to display this image to its users.
Additional permissions should be obtained from the applicable author or publisher of the image.
Full text @ Adv Pharmacol Pharm Sci