
Fig. 1
- ID
- ZDB-IMAGE-210517-10
- Publication
- Schoels et al., 2021 - Single-cell mRNA profiling reveals changes in solute carrier expression and suggests a metabolic switch during zebrafish pronephros development
- All Figures
- Figures for Schoels et al., 2021
|
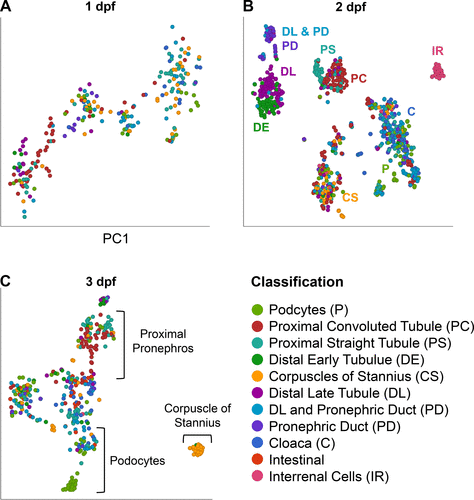
Fig. 1 Single-cell RNA sequence analysis of the developing zebrafish pronephros. A: t-distributed stochastic neighbor embedding (t-SNE) representation based on transcriptome similarities of 591 cells isolated from the zebrafish pronephros at 1 day postfertilization (dpf). Compared with later stages of development, cells did not group in distinct clusters. At 2 dpf, interrenal cells, the adrenocortical equivalent in zebrafish, formed a distinct cluster. B: t-SNE representation based on transcriptome similarities of 918 cells isolated from the zebrafish pronephros at 2 dpf. At this developmental stage, the isolated cells segregated into distinct clusters. C: t-SNE representation based on transcriptome similarities of 556 cells isolated from the zebrafish pronephros at 3 dpf. Although the corpuscles of Stannius and the proximal segments (podocytes and proximal convoluted and straight tubules) remained in distinct clusters, the distal segments overlapped at 3 dpf.