
|
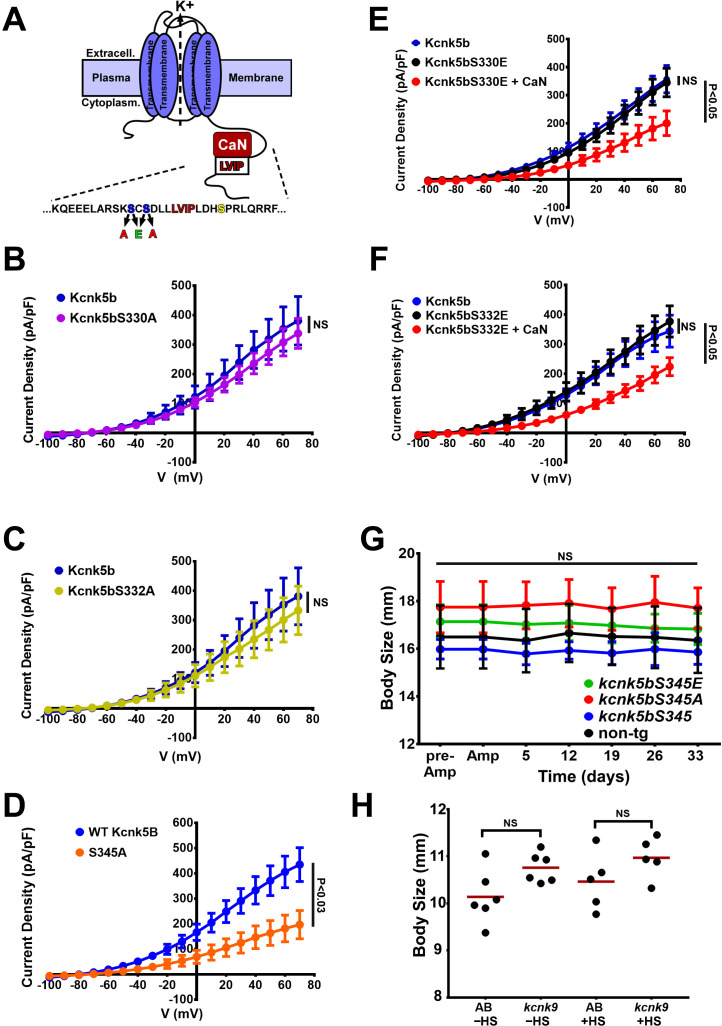
Figure 6—figure supplement 1 (A) Diagram of Kcnk5b channel showing proposed Serine345 calcineurin dephosphorylation site (yellow) adjacent the calcineurin-interaction site (LVIP). Two other serines (blue) were substituted with alanines or glutamic acids to mimic dephosphorylation or phosphorylation. (B) Electrophysiology measurements of wild-type Kcnk5b (blue) and serine-to-alanine mutant Kcnk5bS330A (purple). (C) Electrophysiology measurements of wild-type Kcnk5b (blue) and serine-to-alanine mutant Kcnk5bS332A (yellow). (D) Electrophysiology measurements of wild-type Kcnk5b (blue) and serine-to-alanine mutant Kcnk5bS345A (orange). (E) Electrophysiology measurements of wild-type Kcnk5b (blue), serine-to-glutamic acid mutant Kcnk5bS330E (black), and Kcnk5bS330E plus calcineurin (CaN) (red). (F) Electrophysiology measurements of wild-type Kcnk5b (blue), serine-to-glutamic acid mutant Kcnk5bS332E (black), and Kcnk5bS332E plus calcineurin (CaN) (red). (G) Body length measurements from tip of the head to the base of the fin for each transgenic fish are represented as averages and standard deviation. (H) Body length measurements from tip of the head to the base of the fin for each fish of either wild-type (AB) or Tg[hsp70:kcnk9-GFP] (kcnk9) either without (–HS) or with (+HS) heat shock. The data for each experiment represent three or more experiments. The averaged data points in B-G represent two or more technical replicates per experiment. The data in H show all technical replicates.