
Figure 7
- ID
- ZDB-IMAGE-210512-58
- Genes
- Publication
- Sofou et al., 2021 - Bi-allelic VPS16 variants limit HOPS/CORVET levels and cause a mucopolysaccharidosis-like disease
- All Figures
- Figures for Sofou et al., 2021
|
Figure 7
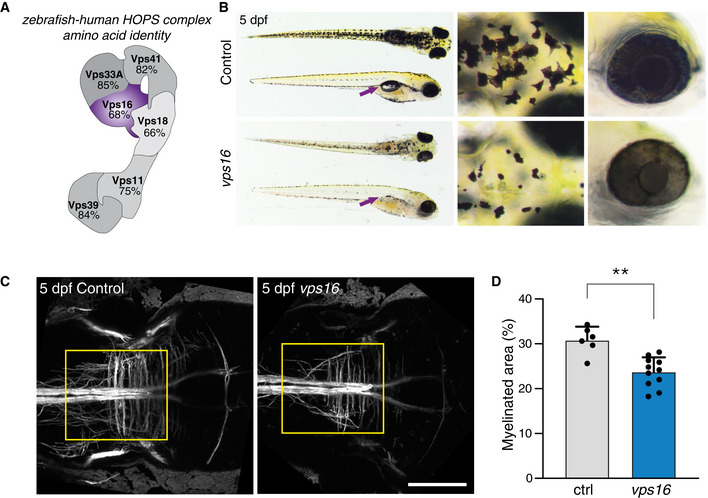
Schematic representation of the HOPS complex, indicating the high amino acid identity between human and zebrafish for each subunit. Comparison of control and Myelination, as reported using the