
|
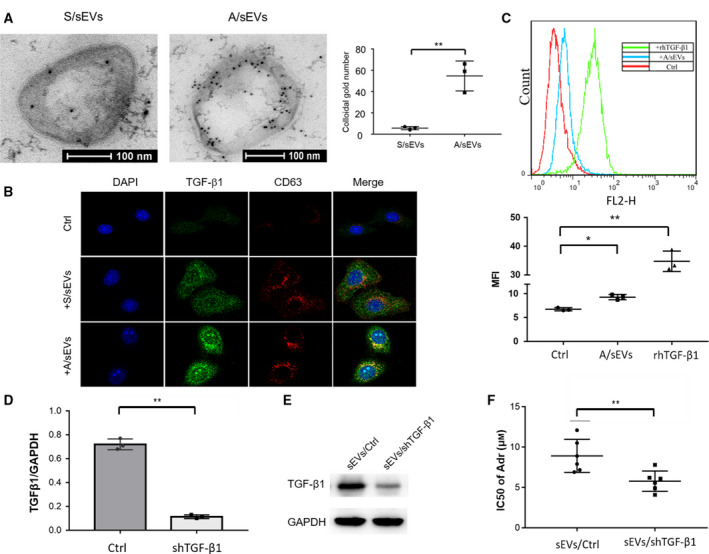
Fig. 3 The effect of sEVs/ TGF-β1 on intercellular adriamycin-resistant transmission. (A) TGF-β1 sorting to sEVs was determined by an immune electron microscope. sEV-embedded gelatin ultracryotomy was incubated with TGF-β1 antibody for staining sEV-carried TGF-β1, and the images were observed by TEM. The amounts of TGF-β1 sorting to sEVs were quantified. (B) After cell-sEV incubation, intracellular co-localization of TGF-β1 with uptake of sEVs was verified by confocal microscope using TGF-β1 antibody (green) and CD63 antibody (red). (C) TGF-β1 abundance was quantified using flow cytometry with the TGF-β1 antibody. (D) TGF-β1 in MCF-7/Adr cells was knocked down using a specific shRNA and confirmed by RT–qPCR. A scramble sequence serves as a control. (E) sEVs were isolated from the TGF-β1-silenced MCF-7/Adr cells, and the reduced level of TGF-β1 was confirmed by western blots. (F) MCF-7 cells were incubated with the isolated sEVs and then treated with adriamycin. The cytotoxicity was quantified by MTT assay and calculated IC50 value. All experiments were repeated, and more than three replicates were included in A and C–F. The data were presented as the mean ± standard deviation. *P < 0.05 and **P < 0.01 represent the significances between two groups as indicated.