
|
Fig. 2
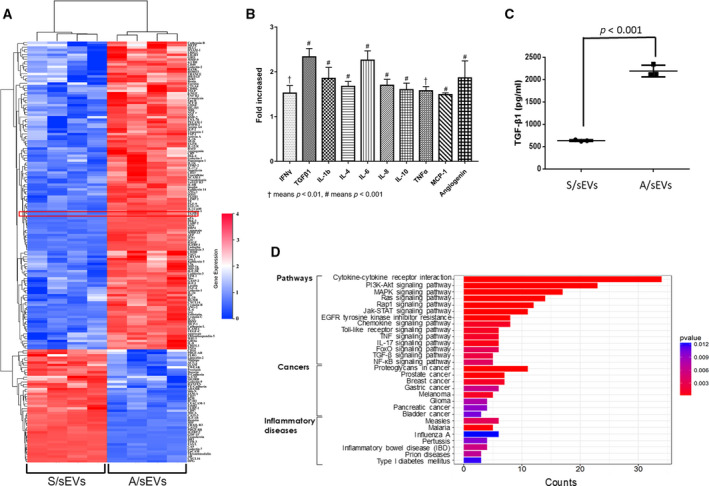
Cytokine abundances in A/sEVs vs. S/sEVs. (A) sEVs isolated from MCF‐7 and MCF‐7/Adr cells were subjected to a human cytokine antibody array to quantify the levels of targeted cytokines. A red box indicated TGF‐β1 profiling. (B) Increased abundances of BCa metastasis‐associated cytokines in A/sEVs vs. S/sEVs. (C) The amounts of TGF‐β1 in A/sEVs and S/sEVs were quantified using a specific ELISA Kit. (D) Alters in cell signaling pathways and relating inflammatory disease and cancers were analyzed using a KEGG enrichment analysis software. Each group of sEVs containing four replicates were quantified, and the significant differences between S/sEVs and A/sEVs were indicated in B and C.