
|
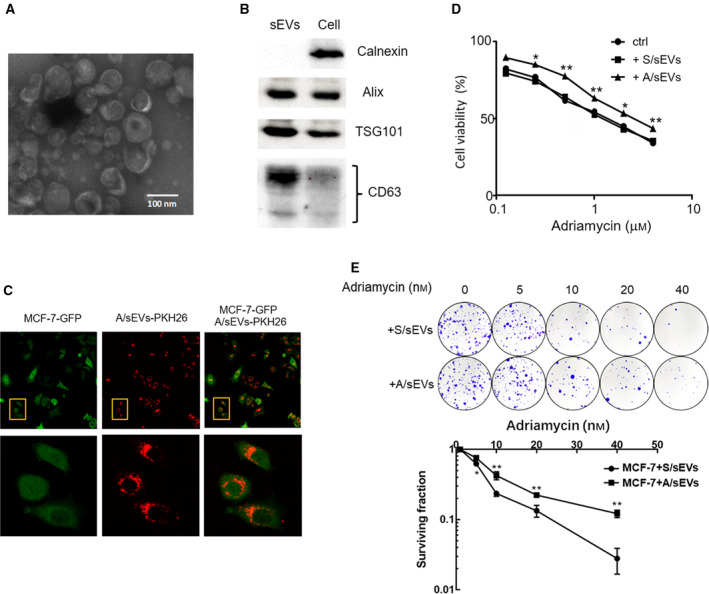
Fig. 1
sEV‐mediated intercellular transmission of adriamycin resistance. (A) sEVs were isolated from the culture medium of MCF/Adr cells and characterized by TEM. (B) The isolated sEVs were further examined by the determination of exosome‐specific proteins CD63, TSG101, and Alix by western blots. Calnexin serves as a cytosolic protein control. (C) MCF‐7 cells were labeled with GFP, and A/sEVs were labeled with PKH26 (red). After incubation of cells with sEVs, sEV intracellular localization was observed using a confocal microscope. Images in the low panel were representative for images in boxes as indicated in the top panel. (D) MCF‐7 cells were incubated with S/sEVs or A/sEVs and then treated with different concentrations of adriamycin as indicated. The cell viability after normalized with cell plating efficiency was analyzed by MTT assay. No sEVs added were a negative control. (E) After cell‐sEV incubation and drug treatment, adriamycin resistance was analyzed by cell colony survival assay. All experiments were repeated, and more than three replicates were included in D and E. The data were presented as the mean ± standard deviation. *