
Fig. 3
- ID
- ZDB-IMAGE-210508-18
- Genes
- Publication
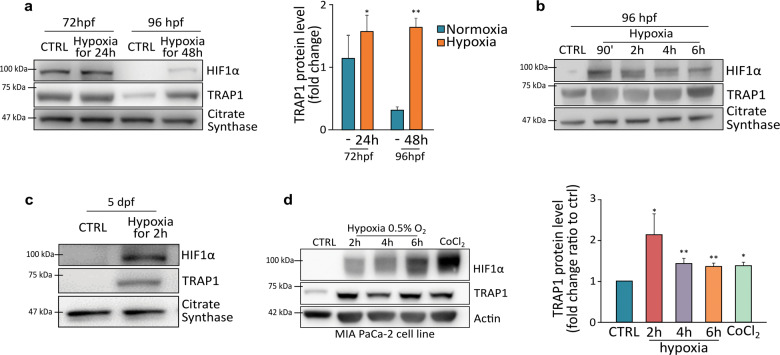
- Laquatra et al., 2021 - HIF1α-dependent induction of the mitochondrial chaperone TRAP1 regulates bioenergetic adaptations to hypoxia
- All Figures
- Figures for Laquatra et al., 2021
|
Fig. 3