
|
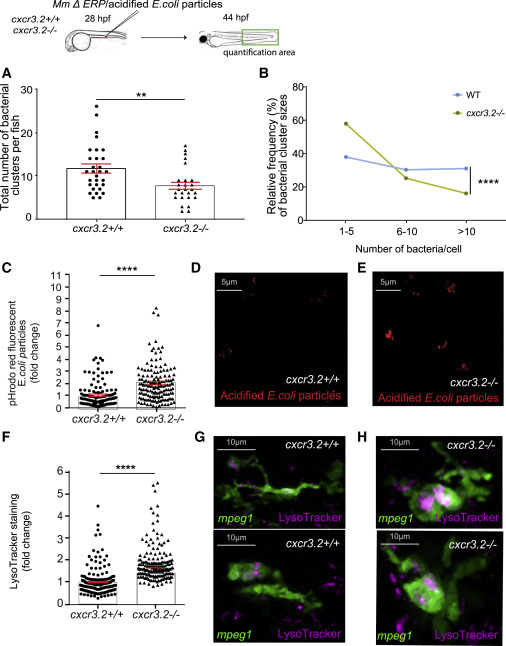
Fig. 2 Upregulation of lysosomal genes in cxcr3.2 mutants is linked with increased microbicidal activity of macrophages (A and B) Quantification of M. marinum ΔERP bacterial clusters in the indicated area showed that infected cxcr3.2 mutants develop fewer bacterial clusters (A) and that cxcr3.2 mutants had mostly small bacterial clusters (1–5 bacteria) and few large clusters (>10 bacteria) compared to the WT (B). (C–E) Normalized intensity of pH-rodo E. coli bioparticle clusters in cxcr3.2 mutants (cxcr3.2−/−) was higher than in WT larvae (cxcr3.2+/+) based on fluorescence quantification (C). Data are expressed as fold change with the average fluorescence intensity in the WT set to 1. Representative confocal images show pH-rodo staining in WT (D) and cxcr3.2 mutant (E). (F–H) Normalized data of LysoTracker staining showed that macrophages (mpeg1:mCherry-F-positive) in cxcr3.2 mutants (cxcr3.2−/−) had higher lysosomal staining than in WT larvae (cxcr3.2+/+) based on fluorescence quantification (F). Data are expressed as fold change with the average fluorescence intensity in the WT set to 1. Representative images are still confocal images of live WT (G) or cxcr3.2 mutant (H) macrophages (shown in green) with LysoTracker staining (shown in pink). A Mann-Whitney test was used to analyze the total number of bacterial clusters per fish of pooled data of two independent replicates of 12–15 fish each (A, C, and F), and a Kolmogorov-Smirnov test was used to analyze the distribution of bacterial cluster sizes (B). All data are shown as mean ± SEM (∗∗p ≤ 0.01, ∗∗∗∗p ≤ 0.0001).