
Fig. 6
- ID
- ZDB-IMAGE-210504-6
- Publication
- Kenyon et al., 2021 - Identification of a novel series of hair-cell MET channel blockers that protect against aminoglycoside-induced ototoxicity
- All Figures
- Figures for Kenyon et al., 2021
|
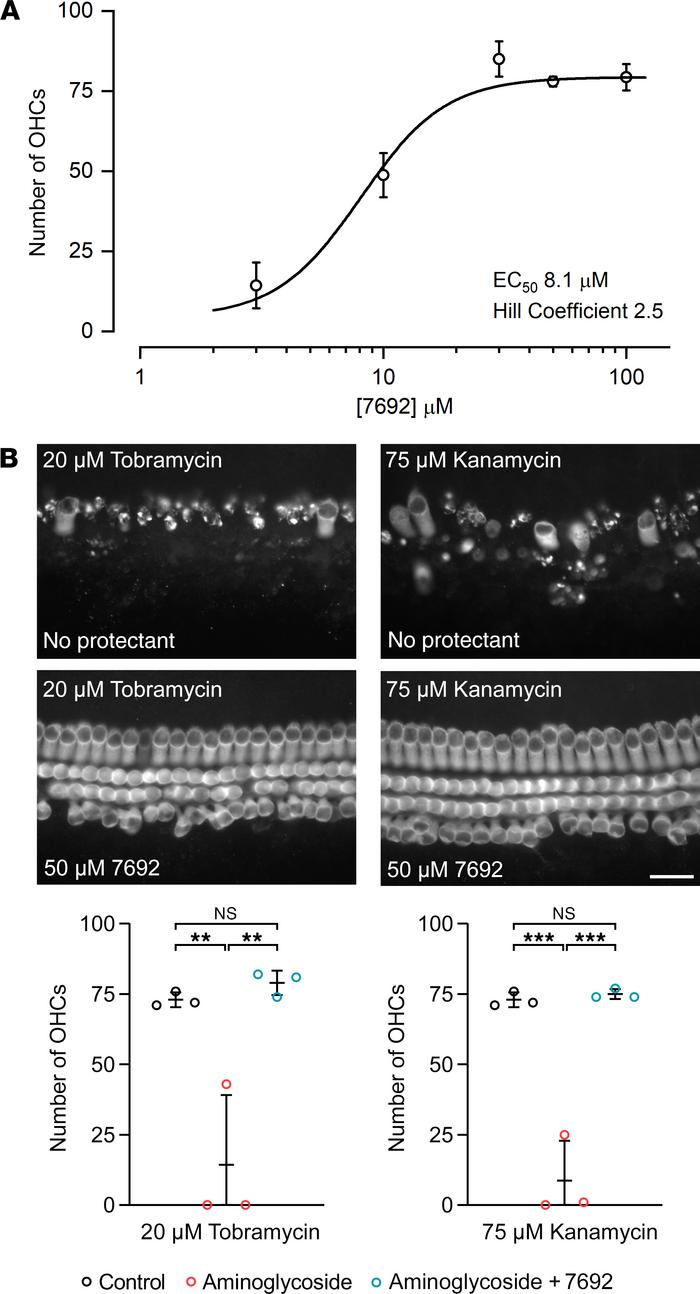
Fig. 6 Dose-response function for gentamicin protection with UoS-7692 and protection from tobramycin and kanamycin by UoS-7692. (A) Dose-response graph showing average number of OHCs in mid-basal ROI from cultures exposed to LSM with 5 μM gentamicin and 3–100 μM UoS-7692 for 48 hours. Graph fitted with equation 1. EC50 value of UoS-7692 is 8.1 μM. Number of cultures: 3 μM (n = 3); 10 μM (n = 5); 30 μM (n = 3); 50 μM (n = 6); 100 μM (n = 3). Error bars show SEM. (B) Micrographs of mid-basal region of cochlear cultures incubated for 48 hours in 20 μM tobramycin (left) or 75 μM kanamycin (right) without (top) or with (bottom) 50 μM UoS-7692. Scale bar: 25 μm. Quantification of OHC survival showed protection from tobramycin- and kanamycin-induced hair-cell death. One-way ANOVA with Tukey’s multiple-comparison test. **P < 0.01; ***P < 0.001. Experiments were performed on 3 independent occasions. Symbols represent data from individual cells. Error bars show SDM.