
|
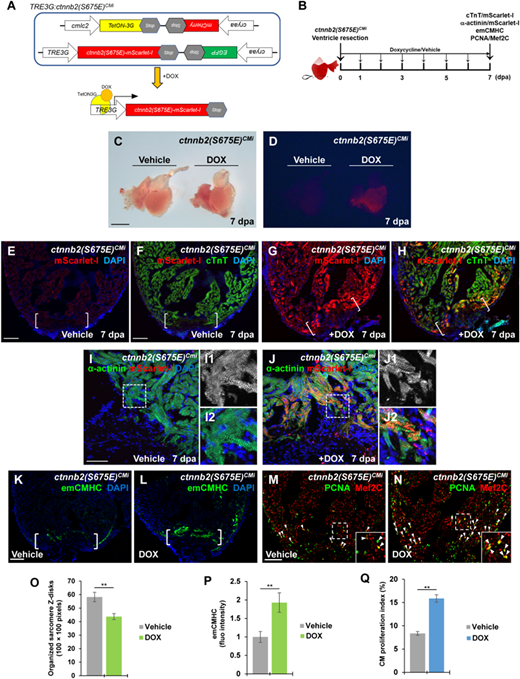
Fig. 6 Induction of phospho-mimetic β-catenin (S675E) in adult CMs enhances sarcomere disassembly and CM dedifferentiation. (A) Schematic diagram of double transgenes of TRE3G:ctnnb2(S675E)CMi. DOX treatment allows binding of TetON-3G to the TRE3G promoter, enabling the tissue-specific transcription of ctnnb2(S675E) in CMs. (B) Experimental strategy to induce myocardial ctnnb2(S675E) overexpression during the course of heart regeneration. Ctnnb2(S675E) induction (mScarlet-I/cTnT), sarcomere disassembly (α-actinin/mScarlet-1), CM dedifferentiation (emCMHC), and proliferation (PCNA/Mef2C) were examined at 7 dpa in vehicle-treated and TOX-treated TRE3G:ctnnb2(S675E)CMi animals. (C and D) Brightfield (C) or red fluorescence (D) images of whole-mount hearts. mScarlet-I signal was only detected in myocardium of DOX-treated hearts. Scale bar, 500 µm. (E‒H) Representative confocal fluorescence images of cardiac sections immunostained for cTnT (green) and mScarlet-I (red). Scale bar, 100 µm. (I, J, and O) Myocardial wound edge regions in heart sections were co-stained for α-actinin (green) and mScarlet-I (red). Scale bar, 50 µm. (I1, I2, J1, and J2) Magnified panels show high-magnification images of the boxed regions in I and J. (O) Quantification of organized sarcomere Z-disks in α-actinin-marked CMs (100 × 100 pixels). (K‒N, P, and Q) Confocal image analyses of emCMHC expression (K and L) and PCNA+Mef2C+ cells (arrowheads, M and N). Brackets indicate amputation planes. Insets show high-magnification images of PCNA+Mef2C+ cells in boxed regions. (P) Fluorescent intensities depicting emCMHC levels were measured at the injury border zone using Image J. emCMHC levels in vehicle-treated hearts are normalized as 1. (Q) PCNA-labeled CM proliferation indices. Scale bar, 100 µm. For bar chart analyses in O‒Q, data are mean ± SEM from five hearts for each group. Student’s t-test, **P < 0.01.