
Fig. 10
- ID
- ZDB-IMAGE-210504-10
- Publication
- Kenyon et al., 2021 - Identification of a novel series of hair-cell MET channel blockers that protect against aminoglycoside-induced ototoxicity
- All Figures
- Figures for Kenyon et al., 2021
|
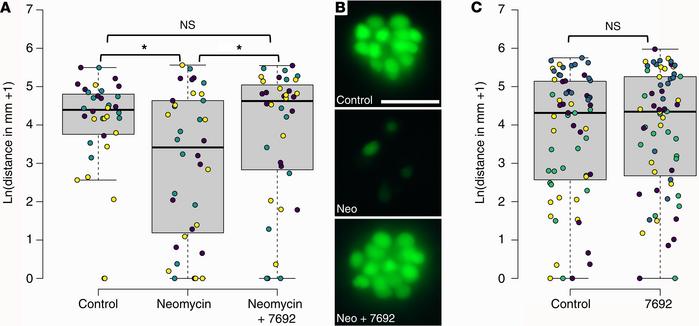
Fig. 10 UoS-7692 preserves larval movement in neomycin-treated zebrafish. (A) Box-and-whisker plots showing movement of 5 dpf zebrafish larvae after treatment with E3 medium, 6.25 μM neomycin, or 25 μM UoS-7692 and 6.25 μM neomycin, followed by washout. Circles show individual larvae with independent experiments grouped by color (n = 3). (B) Images of example neuromasts labeled with YO-PRO-1 after treatment with E3 medium (top), 6.25 μM neomycin (middle), or 25 M UoS-7692 and 6.25 μM neomycin (bottom) after behavioral testing. Scale bar: 20 μm. (C) Box-and-whisker plots showing movement of 5 dpf zebrafish after treatment with either E3 medium or 25 μM UoS-7692 alone followed by washout. Circles show individual larvae with independent experiments grouped by color (n = 4). Black line shows median, gray boxes span the IQR, and whiskers extend over points within additional 1.5 × IQR. Neomycin compared with control larvae P = 0.029, neomycin and UoS-7692 compared with control larvae P = 0.3947, neomycin and UoS-7692 compared with neomycin alone larvae P = 0.0153 (Dunn’s post hoc tests). UoS-7692 alone compared with control larvae t = 0.552, df = 126, P = 0.58 using a 2-sample t test. *P < 0.05.