
Fig. 1
- ID
- ZDB-IMAGE-210504-1
- Publication
- Kenyon et al., 2021 - Identification of a novel series of hair-cell MET channel blockers that protect against aminoglycoside-induced ototoxicity
- All Figures
- Figures for Kenyon et al., 2021
|
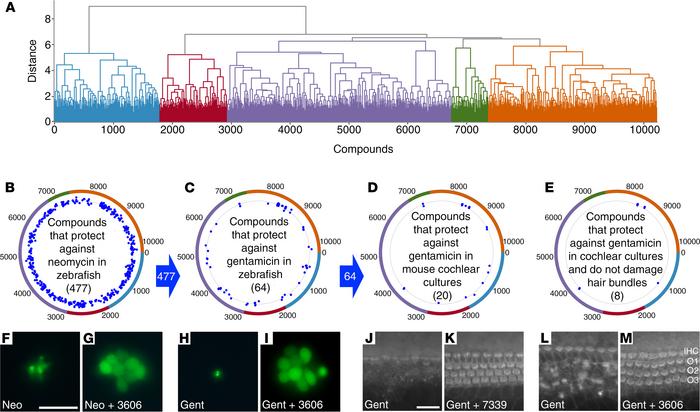
Fig. 1 Screen of 10,240 Life Chemicals Diversity compounds in zebrafish larvae and mouse cochlear cultures. (A) Dendrogram of compounds grouped by broadly related structure into 5 clusters identified by color. (B–E) Polar scatterplots annotated with dendrogram clusters. Blue dots show “hit” compounds in each cluster obtained in each screen (see Supplemental Figure 1). Blue arrows between the plots indicate compounds passing the previous screen were used in the next. (F–M) Representative examples of neuromasts (F–I) and cochlear cultures (J–M) treated with antibiotic alone (F, H, J, and L) or antibiotic in the presence of one of the hit compounds (G, I, K, and M). Neuromasts (F–I) were labeled with YO-PRO-1 prior to incubation with neomycin alone (F), neomycin and UoS-3606 (G), gentamicin alone (H), or gentamicin and UoS-3606 (I). Cochlear cultures (J–M) were labeled with Texas red phalloidin after treatment with gentamicin alone (J and L) and gentamicin with UoS-7339 (K) or UoS-3606 (M). Hair bundles in K show damage; those in M are normal. Scale bars: 20 μm (J–M).