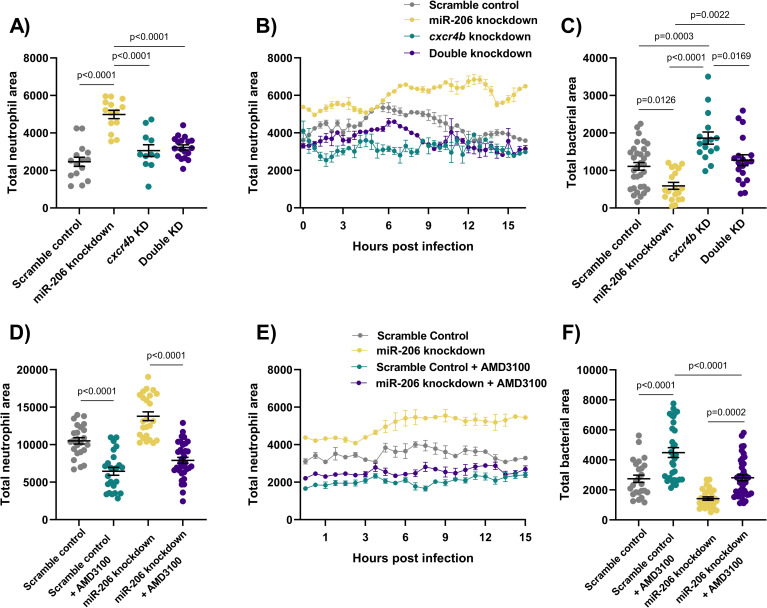
IMAGE

Fig 5

ID
ZDB-IMAGE-210503-150
Source
Figures for Wright et al., 2021
Image
Figure Caption

Fig 5 Cxcr4 reduction places the Cxcl12/Cxcr4 signalling axis downstream of miR-206.

(A) Whole body neutrophil counts at 3 dpi of cxcr4b and double (cxcr4b and miR-206) knockdown embryos. (B) Measurement of neutrophil levels following trunk infection with M. marinum in double knockdown embryos. (C) Bacterial burden at 3 dpi in M. marinum-infected double knockdown embryos. (D) Whole body neutrophil counts at 3 dpi in miR-206 knockdown embryos treatment with AMD3100. (E) Measurement of neutrophil recruitment to M. marinum following trunk injection in miR-206 knockdown embryos treatment with AMD3100. (F) Bacterial burden at 3 dpi in miR-206 knockdown embryos treatment with AMD3100. Each data point represents a single measurement, with the mean and SEM shown. For time-lapse imaging, each data point represents the mean of 6 foci of infection from 6 separate embryos. Bacterial burden analysis was performed on 15–25 embryos per treatment. Graphs are representative of 2 biological replicates, except for AMD3100 data, which is a single biological replicate.

Acknowledgments
This image is the copyrighted work of the attributed author or publisher, and ZFIN has permission only to display this image to its users. Additional permissions should be obtained from the applicable author or publisher of the image. Full text @ PLoS Pathog.