IMAGE

FIGURE 2

ID
ZDB-IMAGE-210501-8
Source
Figures for An et al., 2021
Image
Figure Caption

FIGURE 2

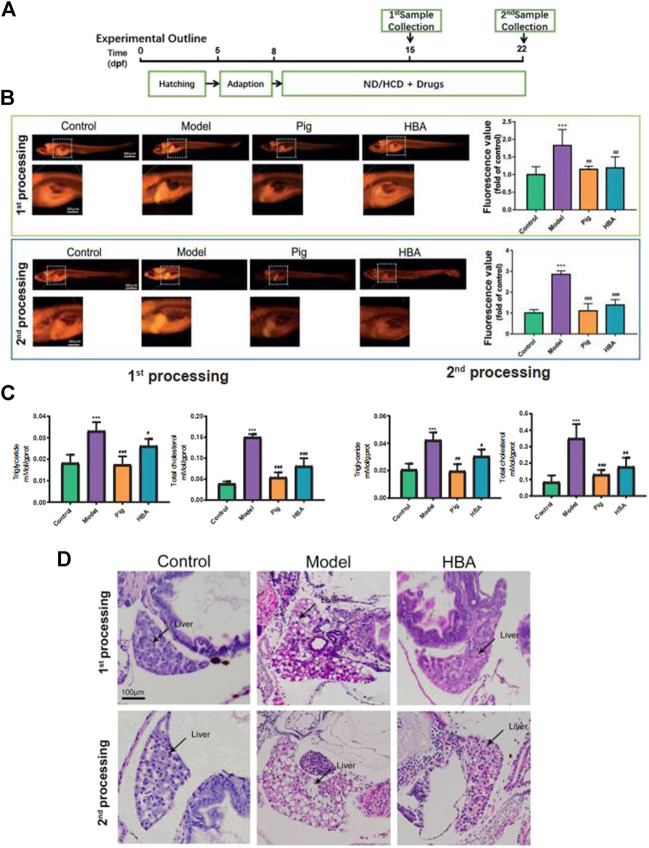
Effect of HBA in regulating lipid metabolism on an HCD-Induced Larval Zebrafish Model in two processes. (A) Experimental outline of the larval zebrafish experiment in vivo. (B) Nile red stain of larval zebrafish and fluorescent quantitation. (C) Triglyceride (TG,mmol/gprot) and total cholesterol (TC,mmol/gprot) of larval zebrafish. (D) Hematoxylin and eosin (HE) staining of larval zebrafish liver, macrovesicular steatosis, and the differences mentioned with black arrows. Bar indicate means ± SD. ***p < 0.001 represent compared with the control; #p < 0.05, ##p < 0.01, ###p < 0.001 represent compared with Model. p < 0.05 was considered as statistically significant calculated by One-way ANOVA followed by Tukey’s test (n = 3, n indicates the replicates of experiment).

Acknowledgments
This image is the copyrighted work of the attributed author or publisher, and ZFIN has permission only to display this image to its users. Additional permissions should be obtained from the applicable author or publisher of the image. Full text @ Front Pharmacol