IMAGE

FIGURE 5

ID
ZDB-IMAGE-210501-11
Source
Figures for An et al., 2021
Image
Figure Caption

FIGURE 5

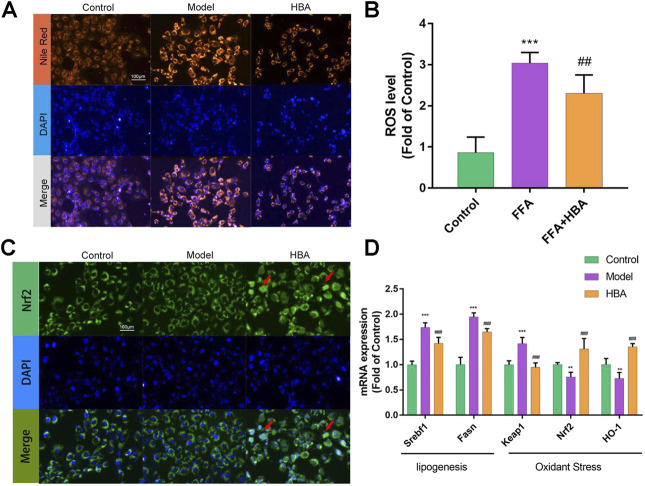
The effect of HBA on FFA-induced BRL-3A cell in vitro(A) Nile red staining of BRL-3A cells after 1 mm FFA with and without HBA (20 μM) treatment to reveal lipid level. (B) Measurement of ROS level in BRL-3A cells after 1 mm FFA with and without HBA (20 μM) treatment. (C) Fluorescence image of FITC-conjugated secondary antibody staining indicates the location of Nrf2 (green), DAPI staining indicates the location of the nucleus (blue), and the merged images show the nuclear location of Nrf2 protein. Red arrows show the HBA-induced translocation of Nrf2 to the nucleus. (D) mRNA expression profile of HBA on FFA induced BRL-3A cell related to lipogenesis and oxidant stress. Bar indicate means ± SD. **p < 0.01***p < 0.001 represent compared with the control; ##p < 0.01, ###p < 0.001 represent compared with Model. p < 0.05 was considered as statistically significant calculated by One-way ANOVA followed by Tukey’s test (n = 3, n indicates the replicates of the experiment).

Acknowledgments
This image is the copyrighted work of the attributed author or publisher, and ZFIN has permission only to display this image to its users. Additional permissions should be obtained from the applicable author or publisher of the image. Full text @ Front Pharmacol