IMAGE

FIGURE 4

ID
ZDB-IMAGE-210501-10
Source
Figures for An et al., 2021
Image
Figure Caption

FIGURE 4

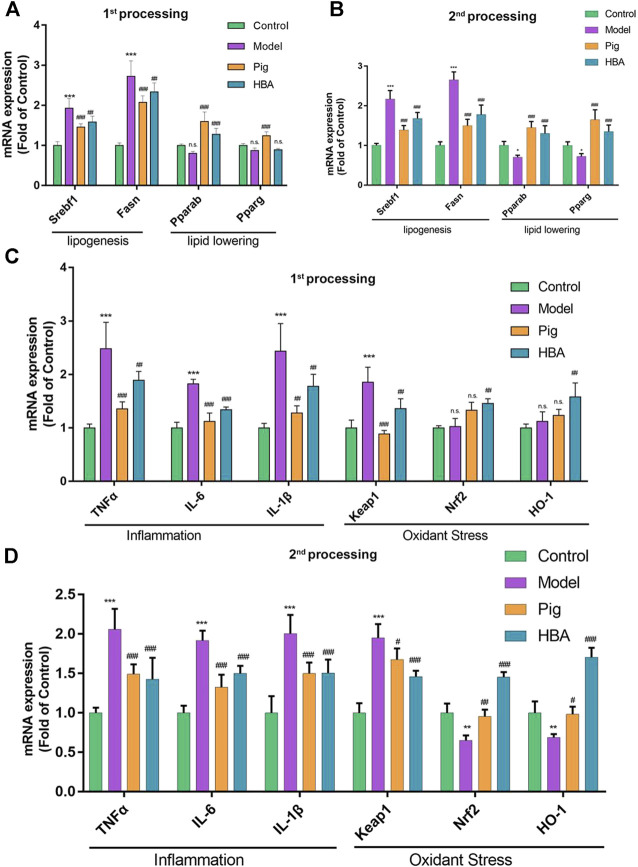
Liver mRNA Expression Changes HBA on the Larval Zebrafish Model. (A,B) the gene expression level of lipogenesis and lipid-lowering of each treated larval zebrafish group in the first process B in the second process. (C,D) the gene expression level of inflammation and oxidant stress of each treated larval zebrafish group in the first process D in the second process. Bars indicate means ± SD. n. s. indicate no significant; *p < 0.05**p < 0.01***p < 0.001 represent compared with the control; #p < 0.05, ##p < 0.01, ###p < 0.001 represent compared with Model. p < 0.05 was considered as statistically significant calculated by One-way ANOVA followed by Tukey’s test (n = 3, n indicates the replicates of the experiment).

Acknowledgments
This image is the copyrighted work of the attributed author or publisher, and ZFIN has permission only to display this image to its users. Additional permissions should be obtained from the applicable author or publisher of the image. Full text @ Front Pharmacol