
Image
|
Figure Caption
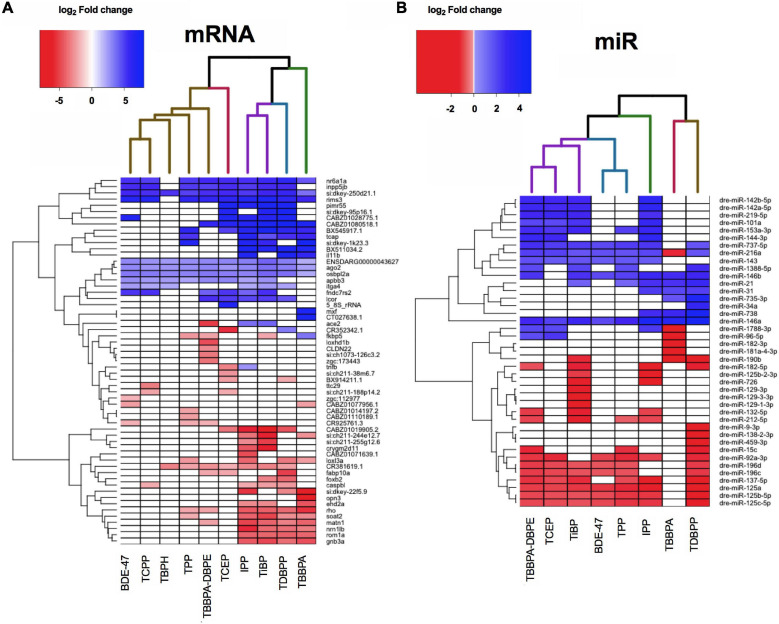
FIGURE 4 Heatmap representing log2 fold changes of (A) top mRNAs and (B) top miRs across FRCs. Up to 5 genes with highest increase and decrease in mRNA or miR expression levels were selected and their fold changes were plotted for all FRCs. Each column dendrogram color represents a cluster.
Acknowledgments
This image is the copyrighted work of the attributed author or publisher, and
ZFIN has permission only to display this image to its users.
Additional permissions should be obtained from the applicable author or publisher of the image.
Full text @ Front Cell Dev Biol