
|
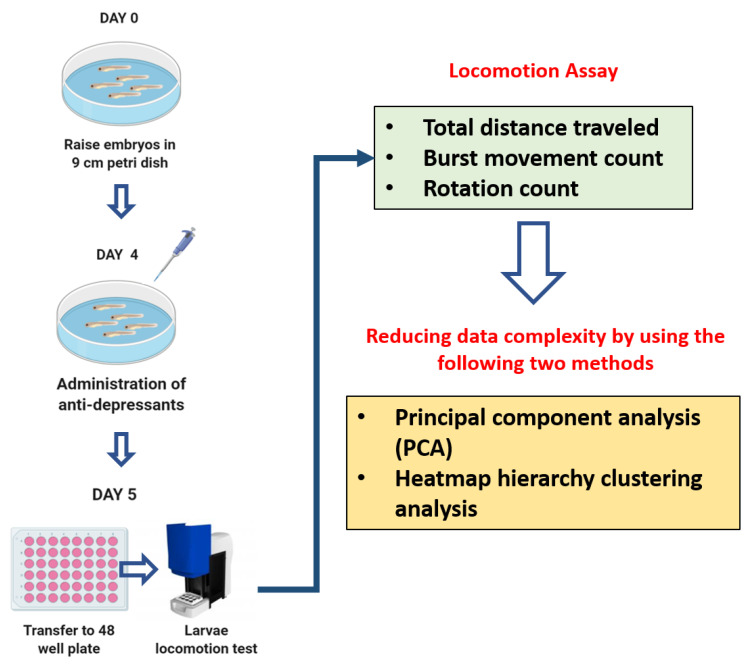
Figure 1 Schematic diagram of the experimental design to evaluate the potential adverse effects of 1 mg/L of 18 different antidepressants in zebrafish larvae. The experimental workflow for antidepressant exposure and locomotor activity measurement for larval zebrafish are illustrated in the upper panel. During locomotion assay, three major endpoints, including total distance traveled, burst count, and rotation count were measured and compared (top-right panel). Finally, two mathematic tools of principal component analysis and hierarchical clustering were used to reduce data complexity and perform similarity grouping (bottom-right panel).