
|
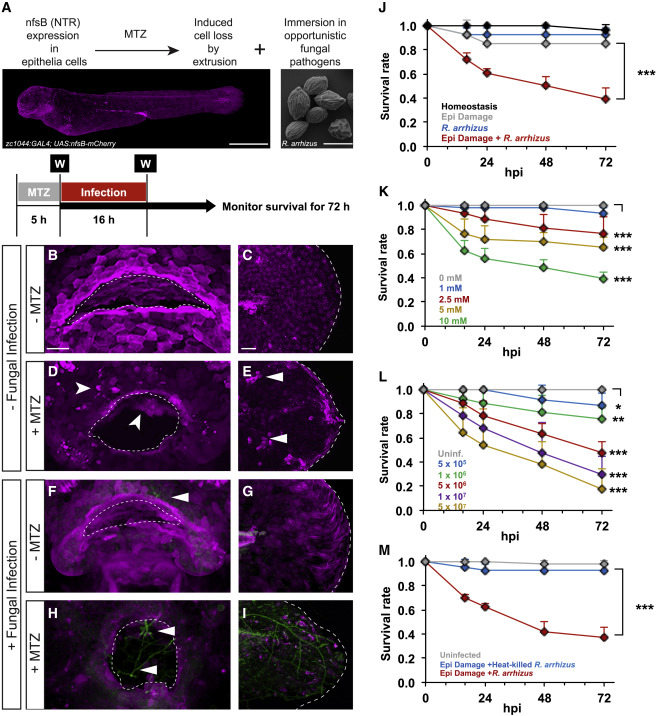
Fig. 1 A model of invasive fungal infection mediated by inducible epithelial cell loss (A) Schematic of a 4 days post fertilization (dpf) zebrafish larva (scale bar, 500 μm); scanning electron microscopy (SEM) image of Rhizopus arrhizus (clinical isolate 749) spores prior to immersion with larvae (scale bar, 5 μm); and timeline of addition and removal of MTZ to induce epithelial damage, addition of 5 × 10⁶/mL R. arrhizus spores for 16 h, and survival monitoring. W, triple wash step. (B–I) Maximum intensity projections of confocal images for (B–I) NTR-mCherry and (F–I) Rhizopus arrhizus-GFP in the orofacial region and tail fin of 5 dpf larvae under homeostatic conditions (B, C, F, and G) and after epithelial damage (D, E, H, and I). Arrowheads in (D) and (E) denote cell extrusion events, and arrowheads in (F) and (H) denote fungal spore attachment and hyphal growth, respectively. Scale bars, 40 μm. (J) Larva survival curves after Rhizopus infection under homeostatic conditions and with tissue damage (n = 27–28 per condition). (K) Survival rates of R. arrhizus-infected larvae with differential intensity of tissue damage (n = 43 per MTZ concentration). (L) Larva survival curves after tissue damage and exposure to differential amounts of R. arrhizus spores (n = 31–33 per inoculum). (M) Survival rates of larvae with mucosal damage infected with 5 × 10⁶ heat-inactivated (30 min, 100°C) or vital R. arrhizus 749 spores (n = 42 per condition). (J–M) Aggregated survival rates across three independent experiments are plotted. Error bars represent SD; Mantel-Cox log rank test.