IMAGE

Figure 5

ID
ZDB-IMAGE-210414-8
Source
Figures for Sipka et al., 2021
Image
Figure Caption

Figure 5

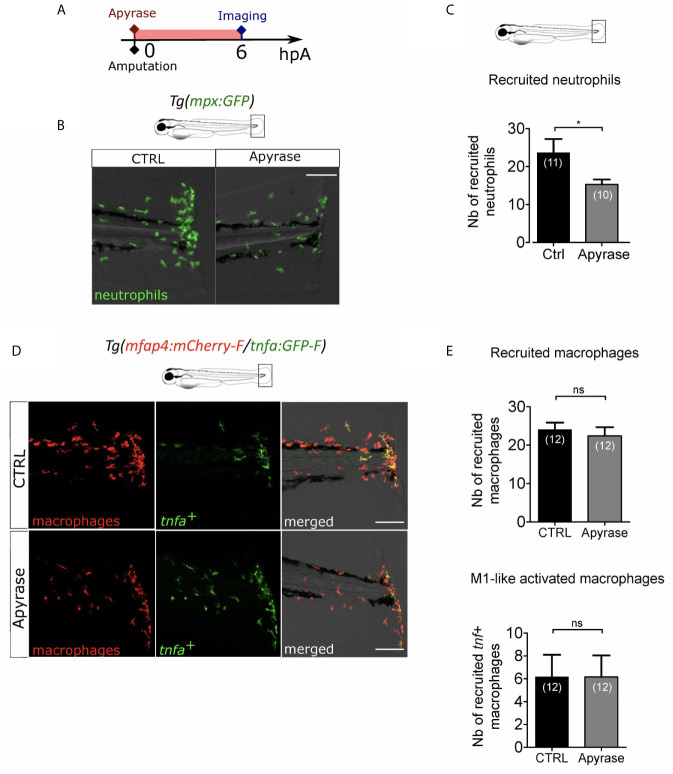
Extracellular ATP is not necessary for macrophage activation. (A) Schedule of the experiment. Fin folds from Tg(mpx:GFP) or Tg(mfap4:mCherry-F/tnfa:GFP-F) were injured at 3 dpf and larvae were immediately incubated in zebrafish water containing or not Apyrase and imaged at 6 hpA using epi-fluorescent or confocal microscopy. (B) Tail images are representative overlays of GFP fluorescence (neutrophils) and brightfield image. Images were acquired at 6 hpA by epi-fluorescent microscopy from Tg(mpx:GFP) larvae either untreated or treated with Apyrase. Scale bar: 100 μm. (C) Quantification of neutrophils recruited at the wound at 6hpA. Representative experiment of two independent experiments, mean ± SEM, nlarvae is indicated in brackets, one-tailed t-test with Welch’s correction, *p<0.05. (D) Tail images are representative maximum projections of the fluorescence of mCherry-F (macrophages), GFP-F (tnfa+ cells) and merged channel images with brightfield of Tg(mfap4:mCherry-F/tnfa:GFP-F) injured larvae after no treatment (control, up) or Apyrase treatment (down) at 6 hpA. Scale bars: 100 μm. (E) Quantification of recruited macrophages (up) and tnfa+ recruited macrophages (down) in controls and in Apyrase treated larvae at 6 hpA. Representative experiment of two independent experiments, mean ± SEM, nlarvae is indicated in brackets, upper graph: t-test, two-tailed, ns- not significant; bottom graph: Mann Whitney test, two-tailed, ns - not significant.

Acknowledgments
This image is the copyrighted work of the attributed author or publisher, and ZFIN has permission only to display this image to its users. Additional permissions should be obtained from the applicable author or publisher of the image. Full text @ Front Immunol