IMAGE

Figure 4

ID
ZDB-IMAGE-210414-7
Source
Figures for Sipka et al., 2021
Image
Figure Caption

Figure 4

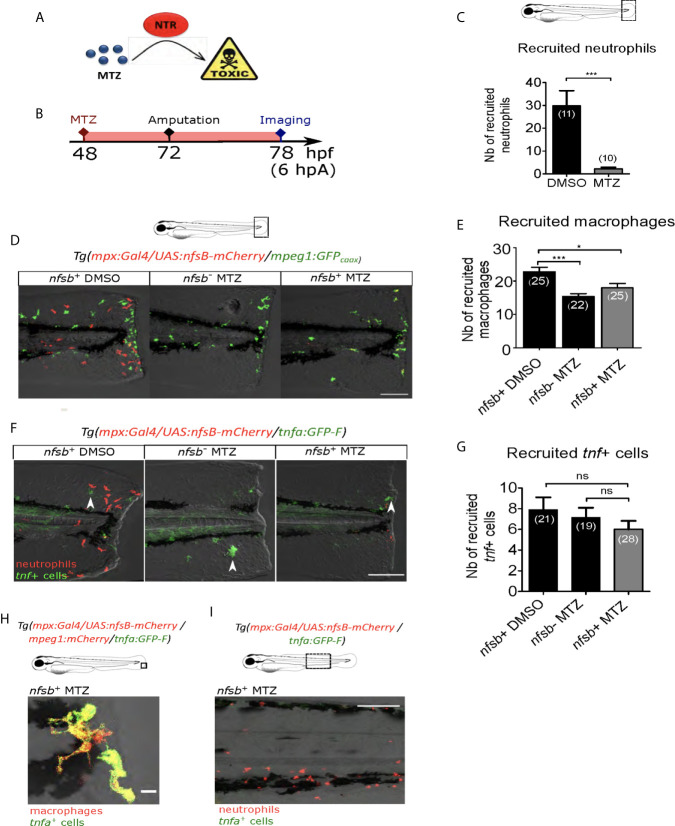
Neutrophil presence at the wound is not necessary for macrophage activation. (A) Mechanism of action of the prodrug metronidazole (MTZ) that is converted into a cell-autonomous toxic molecule in the presence of nitroreductase (NTR). Specific expression of NTR within neutrophils leads to the depletion and immobilization of larval neutrophils. (B) Schedule of the experiment. At 48 hpf Tg(mpx:Gal4/UAS:nfsB-mCherry/tnfa:GFP-F) or Tg(mpx:Gal4/UAS:nfsB-mCherry/mpeg1:GFP-caax) larvae were treated with metronidazole (MTZ) and maintained in the drug until the end of the experiment. Transgenic larvae treated with DMSO and WT siblings treated with MTZ were used as controls. At 3 dpf, fin folds were injured and larvae were imaged at 6 hpA using confocal microscopy. (C) Quantification of recruited neutrophils at the wound at 6 hpA, after the treatment with MTZ or DMSO. Representative experiment of three independent experiments, mean ± SEM, nlarvae is indicated in brackets, one-tailed t-test with Welch’s correction, ***p<0.001. (D)Tg(mpx:Gal4/UAS:nfsB-mCherry/mpeg1:GFP-caax) treated with DMSO (nfsb+ DMSO) or with MTZ (nfsb+ MTZ) and WT siblings with MTZ (nfsb- MTZ). Tail images are representative maximum projections of the fluorescence of mCherry-F (neutrophils), GFP-caax (macrophages) and merged channel images with brightfield at 6 hpA. Scale bar: 100 μm. (E) Quantification of recruited macrophages at the wound at 6 hpA, after the treatment with MTZ or DMSO. Representative experiment of two independent experiments, mean ± SEM, nlarvae is indicated in brackets, upper graph: one-way ANOVA, *p<0.05 ***p<0.001. (F)Tg(mpx:Gal4/UAS:nfsB-mCherry/tnfa:GFP-F) treated with DMSO (nfsb+ DMSO) or with MTZ (nfsb+ MTZ+) and WT siblings with MTZ (nfsb- MTZ+). Tail images are representative maximum projections of the fluorescence of mCherry-F (neutrophils), GFP-F (tnfa+ cells, selected by arrow heads) and merged channel images with brightfield at 6 hpA. Scale bar: 100 μm. (G) Quantification of recruited tnfa+ cells at the wound at 6 hpA in indicated conditions. Two independent experiments merged, mean ± SEM, nlarvae is indicated in brackets, Kruskal-Wallis test, ns: not significant. (H) Quadruple transgenic line Tg(mpx:Gal4/UAS:nfsB-mCherry/mfap4:mCherry/tnfa:GFP-F) treated with MTZ and imaged at 6hpA. Image is the representative zoomed and overlaid maximum projections showing the overlap of the fluorescence of mCherry-F (macrophages) and GFP-F (tnfa+ cells), in the absence of neutrophils at the wound. Scale bar: 10 μm. (I)Tg(mpx:Gal4/UAS:nfsB-mCherry/tnfa:GFP-F) larvae treated with MTZ and imaged at 6hpA in the CHT region. Image is a representative maximum projection of mCherry and GFP-F fluorescences overlaid with brightfield image, showing no potential tnfa (GFP-F+ cells) expressed in the vicinity of neutrophils (mCherry+ cells) upon MTZ treatment. Scale bar: 100 μm.

Acknowledgments
This image is the copyrighted work of the attributed author or publisher, and ZFIN has permission only to display this image to its users. Additional permissions should be obtained from the applicable author or publisher of the image. Full text @ Front Immunol